- WEATHER
Australia
- National
- New South Wales
- Victoria
- Queensland
- Western Australia
- South Australia
- Tasmania
- ACT
- Northern Territory
Long Range Forecasts
- WARNINGS
- RADAR
- SATELLITE
- MAPS & CHARTS
- LONG RANGE
Long Range Forecasts
- CLIMATE
Climate Indicators
- NEWS
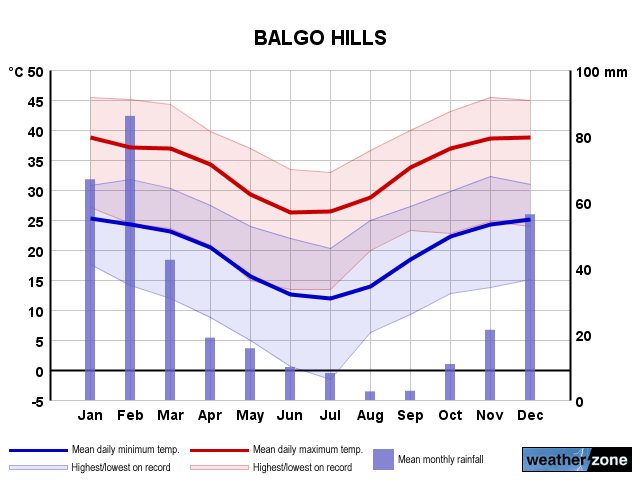
Balgo Hills Long-term Averages
| Jan | Feb | Mar | Apr | May | Jun | Jul | Aug | Sep | Oct | Nov | Dec | Ann | |
|---|---|---|---|---|---|---|---|---|---|---|---|---|---|
| Mean Max (°C) |
38.7 | 37.1 | 36.4 | 34.3 | 29.4 | 26.1 | 26.5 | 29.1 | 34.0 | 37.3 | 38.7 | 38.5 | 33.9 |
| Mean Min (°C) |
25.2 | 24.4 | 23.4 | 20.5 | 16.0 | 12.6 | 12.4 | 14.3 | 18.8 | 22.4 | 24.3 | 24.9 | 20.0 |
| Mean Rain (mm) |
73.4 | 84.6 | 44.9 | 18.0 | 15.5 | 9.1 | 8.2 | 3.2 | 3.0 | 11.3 | 25.2 | 57.4 | 358.1 |
| Median Rain (mm) |
50.8 | 48.3 | 18.1 | 1.6 | 3.2 | 0.2 | 0.0 | 0.0 | 0.0 | 3.2 | 13.6 | 31.1 | 313.8 |
| Mean Rain Days |
7.9 | 7.8 | 4.2 | 1.8 | 2.0 | 1.3 | 1.0 | 0.5 | 0.7 | 2.1 | 4.1 | 6.4 | 38.4 |
Balgo Hills Daily Records
| Jan | Feb | Mar | Apr | May | Jun | Jul | Aug | Sep | Oct | Nov | Dec | Ann | |
|---|---|---|---|---|---|---|---|---|---|---|---|---|---|
| High Max (°C) |
45.4 | 45.1 | 44.2 | 41.3 | 37.1 | 33.4 | 33.2 | 36.6 | 40.0 | 43.1 | 45.5 | 45.5 | 45.5 |
| Low Max (°C) |
24.6 | 24.5 | 23.6 | 20.8 | 15.0 | 11.0 | 13.4 | 14.0 | 18.3 | 22.8 | 24.7 | 23.9 | 11.0 |
| High Min (°C) |
30.8 | 31.7 | 30.2 | 27.9 | 24.0 | 22.0 | 21.4 | 25.0 | 27.3 | 29.8 | 38.0 | 31.3 | 38.0 |
| Low Min (°C) |
17.6 | 18.2 | 15.8 | 11.2 | 7.1 | 3.3 | 3.5 | 5.7 | 9.2 | 12.5 | 13.8 | 15.1 | 3.3 |
| High Rain (mm) |
118.6 | 109.0 | 117.0 | 112.4 | 64.5 | 64.0 | 46.5 | 51.0 | 31.0 | 40.6 | 63.8 | 108.9 | 118.6 |
Balgo Hills Monthly Records
| Jan | Feb | Mar | Apr | May | Jun | Jul | Aug | Sep | Oct | Nov | Dec | Ann | |
|---|---|---|---|---|---|---|---|---|---|---|---|---|---|
| High Mn. Max (°C) |
41.7 | 40.5 | 39.8 | 37.3 | 32.0 | 29.8 | 27.6 | 32.2 | 35.8 | 39.7 | 41.6 | 41.3 | 35.4 |
| Low Mn. Max (°C) |
35.4 | 33.2 | 31.6 | 30.9 | 25.0 | 22.3 | 24.1 | 26.7 | 30.2 | 33.3 | 35.9 | 36.2 | 31.9 |
| High Mn. Min (°C) |
26.8 | 26.2 | 26.2 | 23.3 | 18.7 | 16.7 | 14.0 | 16.2 | 21.4 | 24.7 | 27.2 | 26.0 | 21.1 |
| Low Mn. Min (°C) |
23.9 | 23.1 | 20.0 | 18.0 | 12.4 | 8.7 | 10.6 | 11.5 | 16.3 | 19.9 | 22.3 | 23.8 | 18.8 |
| High Rain (mm) |
315.6 | 382.6 | 286.5 | 201.5 | 101.3 | 143.0 | 74.2 | 69.2 | 75.4 | 78.3 | 140.3 | 230.0 | 907.0 |
| Low Rain (mm) |
0.0 | 0.0 | 0.0 | 0.0 | 0.0 | 0.0 | 0.0 | 0.0 | 0.0 | 0.0 | 0.0 | 1.0 | 90.3 |
Balgo Hills Annual Temperatures & Rainfall
Balgo Hills Average Number of Days With Temperatures
| Jan | Feb | Mar | Apr | May | Jun | Jul | Aug | Sep | Oct | Nov | Dec | Ann | |
|---|---|---|---|---|---|---|---|---|---|---|---|---|---|
| ≥ 40°C |
10.9 | 6.8 | 3.4 | 0.0 | 0.0 | 0.0 | 0.0 | 0.0 | 0.0 | 5.6 | 10.7 | 10.2 | 45.4 |
| ≥ 35°C |
22.4 | 19.6 | 21.3 | 11.3 | 1.2 | 0.0 | 0.0 | 0.9 | 12.9 | 23.2 | 26.0 | 23.3 | 154.3 |
| ≥ 30°C |
25.4 | 25.6 | 27.8 | 24.3 | 14.0 | 4.1 | 4.0 | 12.7 | 24.7 | 27.5 | 28.9 | 26.7 | 233.2 |
| ≤ 2°C |
0.0 | 0.0 | 0.0 | 0.0 | 0.0 | 0.0 | 0.0 | 0.0 | 0.0 | 0.0 | 0.0 | 0.0 | 0.0 |
| ≤ 0°C |
0.0 | 0.0 | 0.0 | 0.0 | 0.0 | 0.0 | 0.0 | 0.0 | 0.0 | 0.0 | 0.0 | 0.0 | 0.0 |
Balgo Hills 'per Week' Values (14th/86th Percentiles)
| Jan | Feb | Mar | Apr | May | Jun | Jul | Aug | Sep | Oct | Nov | Dec | Ann | |
|---|---|---|---|---|---|---|---|---|---|---|---|---|---|
| High Max |
42.0 | 41.0 | 39.6 | 37.3 | 33.2 | 30.2 | 30.0 | 32.5 | 37.1 | 40.2 | 41.5 | 42.0 | 40.0 |
| Low Max |
34.9 | 32.8 | 33.0 | 31.8 | 25.5 | 22.1 | 22.9 | 25.0 | 30.3 | 34.0 | 35.7 | 34.9 | 27.0 |
| High Min |
27.5 | 26.6 | 25.9 | 23.4 | 19.5 | 16.5 | 15.9 | 17.8 | 22.7 | 25.5 | 27.3 | 27.5 | 25.7 |
| Low Min |
22.7 | 22.2 | 21.0 | 17.7 | 12.3 | 8.7 | 9.0 | 10.6 | 15.0 | 19.2 | 21.4 | 22.4 | 13.0 |
Balgo Hills Data Availability
| Jan | Feb | Mar | Apr | May | Jun | Jul | Aug | Sep | Oct | Nov | Dec | Ann | |
|---|---|---|---|---|---|---|---|---|---|---|---|---|---|
| Years of Minima |
23 | 26 | 26 | 24 | 26 | 27 | 23 | 26 | 28 | 28 | 29 | 27 | 26.1 |
| Earliest Entry |
1987 | 1987 | 1987 | 1987 | 1987 | 1987 | 1987 | 1987 | 1986 | 1986 | 1986 | 1986 | 1986 |
| Latest Entry |
2016 | 2016 | 2015 | 2015 | 2015 | 2015 | 2015 | 2015 | 2015 | 2015 | 2015 | 2015 | 2016 |
| Years of Maxima |
24 | 27 | 27 | 25 | 27 | 28 | 24 | 27 | 28 | 28 | 29 | 26 | 26.7 |
| Earliest Entry |
1987 | 1987 | 1987 | 1987 | 1987 | 1987 | 1987 | 1987 | 1986 | 1986 | 1986 | 1986 | 1986 |
| Latest Entry |
2016 | 2016 | 2015 | 2015 | 2015 | 2015 | 2015 | 2015 | 2015 | 2015 | 2015 | 2015 | 2016 |
| Years of Rainfall |
70 | 71 | 71 | 69 | 68 | 68 | 66 | 68 | 67 | 68 | 68 | 66 | 68.2 |
| Earliest Entry |
1940 | 1940 | 1940 | 1940 | 1940 | 1940 | 1940 | 1940 | 1940 | 1940 | 1940 | 1940 | 1940 |
| Latest Entry |
2016 | 2016 | 2015 | 2015 | 2015 | 2015 | 2015 | 2015 | 2015 | 2015 | 2015 | 2015 | 2016 |
Station Details
BALGO HILLS
20.1417°S 127.9867°E
420m AMSL
Commenced 1940 / Closed 2016
Commenced 1940 / Closed 2016
Enter a postcode or town name for local weather, or text to search the site. » advanced search
Generation gone with the wind
13:20 AEST A weeklong stretch of low wind power was broken on Wednesday evening, as a weak cold front marched across southern Australia. The chart below shows that the National Electricity Market (NEM) has endured a weeklong stretch of low wind generation, with wind power providing around 6% of the NEM’s electricity, down from last year’s average of 13.1% (Mon, April 15 to Wed, April 17).
- 11:29 AEST Devilishly dry in Tasmania
- 16:41 AEST Dubai deluge: a year's rainfall in a day
- 11:37 AEST Melbourne weather strongly out of character
- 15:03 AEST BoM declares El Niño over