- WEATHER
Australia
- National
- New South Wales
- Victoria
- Queensland
- Western Australia
- South Australia
- Tasmania
- ACT
- Northern Territory
Long Range Forecasts
- WARNINGS
- RADAR
- SATELLITE
- MAPS & CHARTS
- LONG RANGE
Long Range Forecasts
- CLIMATE
Climate Indicators
- NEWS
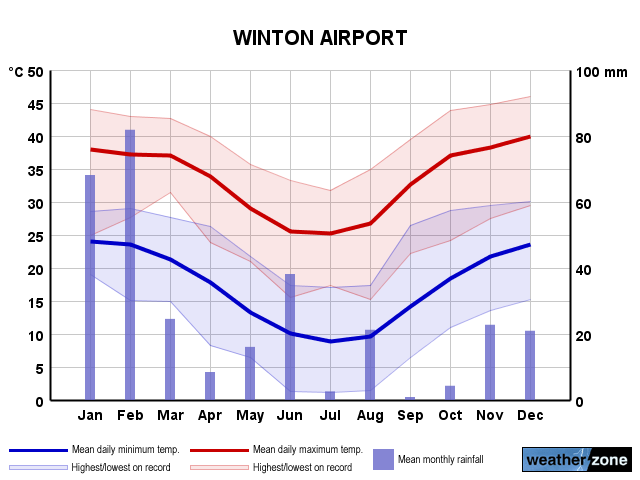
Winton Long-term Averages
| Jan | Feb | Mar | Apr | May | Jun | Jul | Aug | Sep | Oct | Nov | Dec | Ann | |
|---|---|---|---|---|---|---|---|---|---|---|---|---|---|
| Mean Max (°C) |
38.0 | 36.7 | 35.8 | 33.0 | 28.5 | 25.0 | 25.2 | 27.8 | 32.0 | 36.1 | 37.9 | 39.2 | 32.9 |
| Mean Min (°C) |
24.5 | 23.0 | 21.5 | 17.5 | 13.0 | 9.7 | 8.8 | 9.7 | 14.3 | 18.6 | 21.7 | 23.7 | 17.1 |
| Mean Rain (mm) |
88.9 | 71.7 | 62.0 | 20.8 | 10.6 | 19.2 | 17.0 | 11.0 | 7.5 | 9.9 | 27.1 | 35.4 | 385.3 |
| Median Rain (mm) |
76.0 | 66.2 | 21.8 | 8.4 | 10.4 | 5.8 | 0.0 | 3.4 | 0.2 | 0.5 | 16.4 | 24.2 | 333.4 |
| Mean Rain Days |
8.0 | 7.1 | 4.8 | 2.3 | 2.8 | 2.6 | 2.0 | 1.2 | 1.5 | 2.5 | 5.0 | 6.1 | 46.2 |
Winton Daily Records
| Jan | Feb | Mar | Apr | May | Jun | Jul | Aug | Sep | Oct | Nov | Dec | Ann | |
|---|---|---|---|---|---|---|---|---|---|---|---|---|---|
| High Max (°C) |
46.9 | 46.5 | 43.4 | 40.0 | 37.7 | 34.2 | 35.2 | 37.6 | 41.7 | 44.3 | 45.7 | 47.2 | 47.2 |
| Low Max (°C) |
24.2 | 23.0 | 22.1 | 20.1 | 16.0 | 9.1 | 10.0 | 15.2 | 18.0 | 22.6 | 25.3 | 23.1 | 9.1 |
| High Min (°C) |
33.1 | 31.8 | 28.4 | 26.3 | 25.5 | 21.6 | 19.4 | 22.1 | 26.5 | 28.7 | 29.8 | 31.4 | 33.1 |
| Low Min (°C) |
17.0 | 14.4 | 13.2 | 7.6 | 3.0 | 0.4 | 0.8 | 1.5 | 5.3 | 6.0 | 11.4 | 13.7 | 0.4 |
| High Rain (mm) |
117.4 | 78.2 | 101.8 | 91.6 | 47.0 | 49.2 | 66.0 | 68.6 | 42.0 | 27.8 | 52.4 | 54.0 | 117.4 |
Winton Monthly Records
| Jan | Feb | Mar | Apr | May | Jun | Jul | Aug | Sep | Oct | Nov | Dec | Ann | |
|---|---|---|---|---|---|---|---|---|---|---|---|---|---|
| High Mn. Max (°C) |
41.6 | 40.1 | 40.1 | 35.4 | 31.2 | 29.0 | 28.2 | 32.5 | 35.3 | 38.4 | 40.6 | 41.7 | 34.5 |
| Low Mn. Max (°C) |
31.4 | 32.8 | 31.8 | 29.3 | 26.3 | 20.2 | 22.1 | 24.8 | 26.2 | 32.9 | 32.7 | 34.7 | 30.8 |
| High Mn. Min (°C) |
26.5 | 25.1 | 24.9 | 20.4 | 16.8 | 12.8 | 11.6 | 11.8 | 17.2 | 21.3 | 24.7 | 25.2 | 18.2 |
| Low Mn. Min (°C) |
22.7 | 20.5 | 18.0 | 14.1 | 9.6 | 7.7 | 6.5 | 7.5 | 12.5 | 14.7 | 19.2 | 21.5 | 15.9 |
| High Rain (mm) |
222.2 | 169.2 | 268.8 | 156.8 | 54.2 | 85.4 | 121.4 | 89.2 | 51.0 | 40.1 | 113.2 | 94.8 | 733.8 |
| Low Rain (mm) |
0.6 | 3.6 | 0.0 | 0.0 | 0.0 | 0.0 | 0.0 | 0.0 | 0.0 | 0.0 | 0.6 | 0.0 | 141.6 |
Winton Annual Temperatures & Rainfall
Winton Average Number of Days With Temperatures
| Jan | Feb | Mar | Apr | May | Jun | Jul | Aug | Sep | Oct | Nov | Dec | Ann | |
|---|---|---|---|---|---|---|---|---|---|---|---|---|---|
| ≥ 40°C |
10.7 | 4.7 | 2.6 | 0.0 | 0.0 | 0.0 | 0.0 | 0.0 | 0.2 | 4.0 | 9.4 | 14.7 | 46.2 |
| ≥ 35°C |
24.8 | 20.0 | 20.5 | 8.1 | 0.4 | 0.0 | 0.0 | 0.9 | 7.5 | 20.1 | 24.3 | 27.0 | 153.6 |
| ≥ 30°C |
29.1 | 26.6 | 29.5 | 25.5 | 10.9 | 2.1 | 2.1 | 8.9 | 21.2 | 29.0 | 28.8 | 29.9 | 243.7 |
| ≤ 2°C |
0.0 | 0.0 | 0.0 | 0.0 | 0.0 | 0.3 | 0.6 | 0.2 | 0.0 | 0.0 | 0.0 | 0.0 | 1.1 |
| ≤ 0°C |
0.0 | 0.0 | 0.0 | 0.0 | 0.0 | 0.0 | 0.0 | 0.0 | 0.0 | 0.0 | 0.0 | 0.0 | 0.0 |
Winton 'per Week' Values (14th/86th Percentiles)
| Jan | Feb | Mar | Apr | May | Jun | Jul | Aug | Sep | Oct | Nov | Dec | Ann | |
|---|---|---|---|---|---|---|---|---|---|---|---|---|---|
| High Max |
40.9 | 39.9 | 38.1 | 35.8 | 31.4 | 29.1 | 28.6 | 32.5 | 36.7 | 39.3 | 41.0 | 42.8 | 39.2 |
| Low Max |
31.8 | 32.1 | 33.3 | 29.7 | 25.4 | 20.1 | 21.1 | 23.0 | 27.3 | 32.9 | 35.0 | 35.6 | 25.4 |
| High Min |
26.0 | 25.3 | 23.8 | 20.8 | 17.0 | 14.3 | 12.5 | 14.6 | 19.1 | 22.6 | 25.0 | 26.8 | 24.0 |
| Low Min |
21.7 | 20.0 | 17.6 | 13.7 | 8.6 | 4.8 | 4.3 | 5.3 | 9.5 | 14.4 | 17.7 | 20.2 | 8.7 |
Winton Data Availability
| Jan | Feb | Mar | Apr | May | Jun | Jul | Aug | Sep | Oct | Nov | Dec | Ann | |
|---|---|---|---|---|---|---|---|---|---|---|---|---|---|
| Years of Minima |
22 | 22 | 22 | 21 | 21 | 21 | 21 | 21 | 21 | 21 | 22 | 22 | 21.0 |
| Earliest Entry |
2003 | 2003 | 2003 | 2003 | 2003 | 2003 | 2003 | 2003 | 2003 | 2002 | 2002 | 2002 | 2002 |
| Latest Entry |
2024 | 2024 | 2024 | 2024 | 2023 | 2023 | 2023 | 2023 | 2023 | 2023 | 2023 | 2023 | 2024 |
| Years of Maxima |
21 | 22 | 22 | 21 | 21 | 21 | 21 | 21 | 21 | 21 | 22 | 22 | 21.0 |
| Earliest Entry |
2003 | 2003 | 2003 | 2003 | 2003 | 2003 | 2003 | 2003 | 2003 | 2002 | 2002 | 2002 | 2002 |
| Latest Entry |
2024 | 2024 | 2024 | 2024 | 2023 | 2023 | 2023 | 2023 | 2023 | 2023 | 2023 | 2023 | 2024 |
| Years of Rainfall |
22 | 21 | 22 | 21 | 19 | 20 | 21 | 21 | 20 | 20 | 22 | 22 | 21.0 |
| Earliest Entry |
2003 | 2003 | 2003 | 2003 | 2003 | 2003 | 2003 | 2003 | 2003 | 2002 | 2002 | 2002 | 2002 |
| Latest Entry |
2024 | 2024 | 2024 | 2024 | 2023 | 2023 | 2023 | 2023 | 2023 | 2023 | 2023 | 2023 | 2024 |
Station Details
WINTON AIRPORT
Central West, Queensland
Central West, Queensland
22.3617°S 143.0836°E
193m AMSL
Commenced 2002
Commenced 2002
Enter a postcode or town name for local weather, or text to search the site. » advanced search
Australia's tropical cyclone season coming to an end
16:40 AEST The 2023-24 Australian tropical cyclone season is almost over and while it was a quiet season based on overall numbers, some of the landfalling systems had a big impact.
- 10:07 AEST Wind returning to southeastern Australia
- 16:32 AEST Anzac Day dawn service weather around Australia
- 12:19 AEST Coldest April night in 25 years for SA towns
- 14:01 AEST Canberra's first sub-zero of the year