- WEATHER
Australia
- National
- New South Wales
- Victoria
- Queensland
- Western Australia
- South Australia
- Tasmania
- ACT
- Northern Territory
Long Range Forecasts
- WARNINGS
- RADAR
- SATELLITE
- MAPS & CHARTS
- LONG RANGE
Long Range Forecasts
- CLIMATE
Climate Indicators
- NEWS
Collarenebri Long-term Averages
| Jan | Feb | Mar | Apr | May | Jun | Jul | Aug | Sep | Oct | Nov | Dec | Ann | |
|---|---|---|---|---|---|---|---|---|---|---|---|---|---|
| Mean Max (°C) |
35.2 | 33.9 | 31.8 | 27.5 | 22.7 | 19.4 | 18.7 | 20.9 | 24.7 | 28.6 | 31.7 | 34.3 | 27.5 |
| Mean Min (°C) |
20.9 | 20.5 | 17.8 | 12.9 | 8.6 | 5.5 | 4.2 | 5.2 | 8.8 | 12.9 | 16.6 | 19.3 | 12.7 |
| Mean Rain (mm) |
68.7 | 57.5 | 49.6 | 33.9 | 34.4 | 34.8 | 34.0 | 26.5 | 26.0 | 37.5 | 47.0 | 52.3 | 497.6 |
| Median Rain (mm) |
40.0 | 36.3 | 30.6 | 21.4 | 20.1 | 26.7 | 23.4 | 17.1 | 16.6 | 30.8 | 34.5 | 36.5 | 477.1 |
| Mean Rain Days |
5.4 | 4.7 | 4.5 | 3.2 | 3.9 | 4.8 | 4.6 | 4.0 | 3.8 | 4.7 | 5.1 | 5.1 | 53.6 |
Collarenebri Daily Records
| Jan | Feb | Mar | Apr | May | Jun | Jul | Aug | Sep | Oct | Nov | Dec | Ann | |
|---|---|---|---|---|---|---|---|---|---|---|---|---|---|
| High Max (°C) |
48.0 | 44.6 | 42.1 | 37.6 | 32.6 | 28.3 | 29.1 | 36.6 | 39.0 | 41.5 | 45.2 | 46.0 | 48.0 |
| Low Max (°C) |
21.0 | 17.6 | 18.0 | 15.7 | 13.1 | 9.3 | 9.4 | 10.9 | 12.8 | 16.5 | 16.4 | 18.5 | 9.3 |
| High Min (°C) |
32.3 | 31.3 | 27.3 | 23.4 | 21.1 | 16.5 | 18.0 | 17.4 | 24.8 | 24.8 | 30.6 | 31.3 | 32.3 |
| Low Min (°C) |
10.2 | 8.4 | 4.3 | -1.0 | -1.8 | -4.1 | -4.6 | -5.0 | -1.6 | 3.4 | 5.0 | 7.5 | -5.0 |
| High Rain (mm) |
312.0 | 158.2 | 128.2 | 170.2 | 82.8 | 71.8 | 64.8 | 62.5 | 66.2 | 63.0 | 97.3 | 103.6 | 312.0 |
Collarenebri Monthly Records
| Jan | Feb | Mar | Apr | May | Jun | Jul | Aug | Sep | Oct | Nov | Dec | Ann | |
|---|---|---|---|---|---|---|---|---|---|---|---|---|---|
| High Mn. Max (°C) |
39.1 | 37.8 | 36.0 | 31.2 | 25.0 | 21.5 | 21.4 | 25.6 | 29.4 | 33.3 | 37.5 | 38.2 | 30.1 |
| Low Mn. Max (°C) |
29.4 | 28.3 | 28.0 | 23.6 | 20.8 | 16.6 | 15.2 | 17.4 | 20.0 | 24.2 | 26.8 | 29.1 | 25.6 |
| High Mn. Min (°C) |
23.9 | 23.1 | 20.3 | 15.8 | 12.3 | 8.4 | 8.3 | 9.0 | 12.7 | 15.9 | 21.1 | 21.7 | 14.2 |
| Low Mn. Min (°C) |
18.3 | 18.0 | 14.9 | 9.6 | 4.3 | 3.1 | 0.1 | 2.1 | 5.9 | 10.7 | 13.5 | 16.6 | 11.0 |
| High Rain (mm) |
508.4 | 351.4 | 254.2 | 356.0 | 216.2 | 148.1 | 159.7 | 135.0 | 157.3 | 167.1 | 241.2 | 216.4 | 1025.0 |
| Low Rain (mm) |
0.0 | 0.0 | 0.0 | 0.0 | 0.0 | 0.0 | 0.0 | 0.0 | 0.0 | 0.0 | 0.0 | 0.0 | 121.2 |
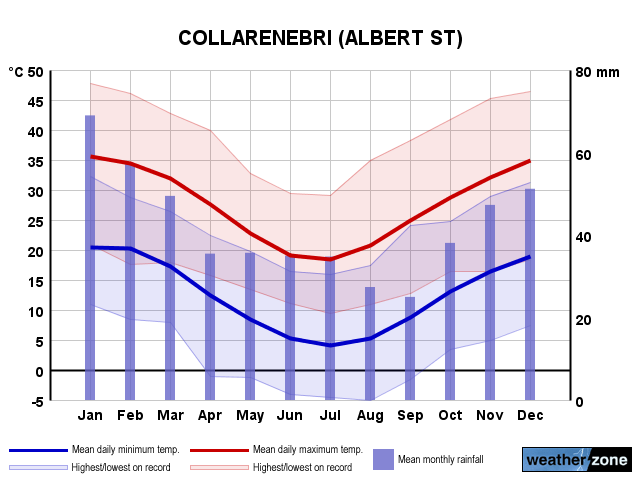
Collarenebri Annual Temperatures & Rainfall
Collarenebri Average Number of Days With Temperatures
| Jan | Feb | Mar | Apr | May | Jun | Jul | Aug | Sep | Oct | Nov | Dec | Ann | |
|---|---|---|---|---|---|---|---|---|---|---|---|---|---|
| ≥ 40°C |
3.4 | 1.4 | 0.3 | 0.0 | 0.0 | 0.0 | 0.0 | 0.0 | 0.0 | 0.1 | 1.2 | 2.6 | 8.8 |
| ≥ 35°C |
15.3 | 11.0 | 5.5 | 0.3 | 0.0 | 0.0 | 0.0 | 0.0 | 0.4 | 2.4 | 6.9 | 13.7 | 54.0 |
| ≥ 30°C |
25.2 | 22.0 | 20.9 | 7.2 | 0.2 | 0.0 | 0.0 | 0.5 | 4.0 | 11.4 | 17.6 | 23.9 | 129.3 |
| ≤ 2°C |
0.0 | 0.0 | 0.0 | 0.1 | 1.2 | 5.6 | 9.7 | 7.4 | 1.4 | 0.0 | 0.0 | 0.0 | 24.8 |
| ≤ 0°C |
0.0 | 0.0 | 0.0 | 0.0 | 0.3 | 2.0 | 4.5 | 2.9 | 0.3 | 0.0 | 0.0 | 0.0 | 10.0 |
Collarenebri 'per Week' Values (14th/86th Percentiles)
| Jan | Feb | Mar | Apr | May | Jun | Jul | Aug | Sep | Oct | Nov | Dec | Ann | |
|---|---|---|---|---|---|---|---|---|---|---|---|---|---|
| High Max |
39.4 | 38.0 | 35.3 | 31.1 | 26.4 | 22.8 | 22.1 | 24.9 | 30.0 | 33.7 | 36.9 | 39.0 | 35.3 |
| Low Max |
30.7 | 29.7 | 27.8 | 23.1 | 19.0 | 15.4 | 14.9 | 16.7 | 19.4 | 23.5 | 26.1 | 29.8 | 19.0 |
| High Min |
24.0 | 23.3 | 21.0 | 17.0 | 13.5 | 9.9 | 9.3 | 10.4 | 14.0 | 17.5 | 20.6 | 23.0 | 20.6 |
| Low Min |
17.4 | 17.3 | 13.9 | 8.0 | 3.9 | 1.2 | -0.2 | 0.7 | 4.0 | 8.2 | 11.9 | 14.9 | 4.0 |
Collarenebri Data Availability
| Jan | Feb | Mar | Apr | May | Jun | Jul | Aug | Sep | Oct | Nov | Dec | Ann | |
|---|---|---|---|---|---|---|---|---|---|---|---|---|---|
| Years of Minima |
37 | 44 | 45 | 43 | 47 | 46 | 43 | 43 | 45 | 37 | 44 | 37 | 43.0 |
| Earliest Entry |
1965 | 1965 | 1965 | 1965 | 1965 | 1965 | 1965 | 1965 | 1965 | 1965 | 1965 | 1965 | 1965 |
| Latest Entry |
2024 | 2024 | 2024 | 2023 | 2023 | 2023 | 2023 | 2023 | 2023 | 2023 | 2023 | 2023 | 2024 |
| Years of Maxima |
40 | 43 | 42 | 43 | 48 | 44 | 43 | 43 | 46 | 40 | 46 | 38 | 46.0 |
| Earliest Entry |
1965 | 1965 | 1965 | 1965 | 1965 | 1965 | 1965 | 1965 | 1965 | 1965 | 1965 | 1965 | 1965 |
| Latest Entry |
2024 | 2024 | 2024 | 2023 | 2023 | 2023 | 2023 | 2023 | 2023 | 2023 | 2023 | 2023 | 2024 |
| Years of Rainfall |
138 | 139 | 137 | 137 | 138 | 137 | 137 | 138 | 136 | 137 | 134 | 139 | 137.0 |
| Earliest Entry |
1885 | 1885 | 1885 | 1885 | 1885 | 1885 | 1885 | 1885 | 1885 | 1885 | 1885 | 1884 | 1884 |
| Latest Entry |
2024 | 2024 | 2024 | 2023 | 2023 | 2023 | 2023 | 2023 | 2023 | 2023 | 2023 | 2023 | 2024 |
Station Details
COLLARENEBRI (ALBERT ST)
Upper Western, New South Wales/ACT
Upper Western, New South Wales/ACT
29.5406°S 148.5817°E
145m AMSL
Commenced 1884
Commenced 1884
Enter a postcode or town name for local weather, or text to search the site. » advanced search
Generation gone with the wind
13:20 AEST A weeklong stretch of low wind power was broken on Wednesday evening, as a weak cold front marched across southern Australia. The chart below shows that the National Electricity Market (NEM) has endured a weeklong stretch of low wind generation, with wind power providing around 6% of the NEM’s electricity, down from last year’s average of 13.1% (Mon, April 15 to Wed, April 17).
- 11:29 AEST Devilishly dry in Tasmania
- 16:41 AEST Dubai deluge: a year's rainfall in a day
- 11:37 AEST Melbourne weather strongly out of character
- 15:03 AEST BoM declares El Niño over