- WEATHER
Australia
- National
- New South Wales
- Victoria
- Queensland
- Western Australia
- South Australia
- Tasmania
- ACT
- Northern Territory
Long Range Forecasts
- WARNINGS
- RADAR
- SATELLITE
- MAPS & CHARTS
- LONG RANGE
Long Range Forecasts
- CLIMATE
Climate Indicators
- NEWS
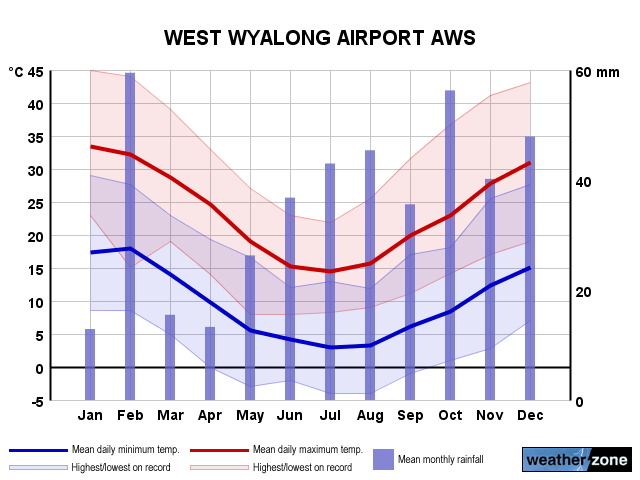
West Wyalong Ap Long-term Averages
| Jan | Feb | Mar | Apr | May | Jun | Jul | Aug | Sep | Oct | Nov | Dec | Ann | |
|---|---|---|---|---|---|---|---|---|---|---|---|---|---|
| Mean Max (°C) |
34.1 | 32.3 | 29.0 | 24.2 | 18.9 | 15.0 | 14.5 | 16.2 | 20.6 | 24.6 | 28.4 | 31.3 | 24.1 |
| Mean Min (°C) |
18.4 | 17.5 | 14.5 | 9.9 | 5.7 | 3.9 | 3.0 | 3.4 | 5.6 | 9.0 | 13.0 | 15.4 | 9.9 |
| Mean Rain (mm) |
42.7 | 44.5 | 42.0 | 26.4 | 32.2 | 44.8 | 41.4 | 38.7 | 37.1 | 46.7 | 52.8 | 47.1 | 480.8 |
| Median Rain (mm) |
11.0 | 32.1 | 15.1 | 16.0 | 18.4 | 23.8 | 36.9 | 27.2 | 22.8 | 40.1 | 25.6 | 37.4 | 404.2 |
| Mean Rain Days |
5.9 | 5.5 | 6.4 | 5.1 | 7.2 | 13.0 | 14.3 | 10.0 | 6.6 | 7.4 | 7.4 | 6.4 | 94.6 |
West Wyalong Ap Daily Records
| Jan | Feb | Mar | Apr | May | Jun | Jul | Aug | Sep | Oct | Nov | Dec | Ann | |
|---|---|---|---|---|---|---|---|---|---|---|---|---|---|
| High Max (°C) |
46.3 | 46.3 | 42.2 | 35.8 | 28.3 | 23.6 | 22.4 | 28.6 | 34.6 | 38.0 | 43.6 | 44.6 | 46.3 |
| Low Max (°C) |
21.8 | 15.1 | 15.6 | 12.1 | 8.0 | 7.4 | 7.0 | 8.0 | 9.6 | 11.6 | 12.3 | 18.0 | 7.0 |
| High Min (°C) |
30.3 | 33.3 | 24.0 | 21.4 | 17.5 | 13.2 | 13.9 | 15.4 | 19.0 | 23.3 | 26.3 | 29.2 | 33.3 |
| Low Min (°C) |
8.6 | 6.9 | 4.9 | -0.1 | -3.0 | -3.8 | -5.6 | -4.0 | -2.4 | 0.6 | 2.0 | 5.5 | -5.6 |
| High Rain (mm) |
62.2 | 73.0 | 86.4 | 39.0 | 45.4 | 48.8 | 49.0 | 31.4 | 54.2 | 44.4 | 74.8 | 62.0 | 86.4 |
West Wyalong Ap Monthly Records
| Jan | Feb | Mar | Apr | May | Jun | Jul | Aug | Sep | Oct | Nov | Dec | Ann | |
|---|---|---|---|---|---|---|---|---|---|---|---|---|---|
| High Mn. Max (°C) |
39.3 | 34.8 | 31.5 | 29.0 | 20.5 | 16.5 | 16.2 | 18.6 | 24.8 | 29.2 | 33.2 | 34.8 | 25.5 |
| Low Mn. Max (°C) |
29.0 | 29.0 | 26.0 | 21.3 | 17.1 | 13.7 | 12.5 | 13.5 | 17.0 | 20.9 | 23.6 | 27.8 | 22.6 |
| High Mn. Min (°C) |
23.6 | 19.8 | 16.9 | 12.6 | 8.4 | 6.2 | 5.9 | 5.1 | 7.4 | 12.3 | 17.2 | 18.6 | 11.5 |
| Low Mn. Min (°C) |
15.0 | 14.7 | 12.5 | 7.1 | 3.2 | 0.7 | 1.1 | 1.3 | 3.8 | 6.8 | 9.8 | 12.0 | 8.4 |
| High Rain (mm) |
193.4 | 155.4 | 176.8 | 136.6 | 104.4 | 162.4 | 84.6 | 102.0 | 166.6 | 152.6 | 132.2 | 185.0 | 927.6 |
| Low Rain (mm) |
1.0 | 0.0 | 0.0 | 0.0 | 1.2 | 1.8 | 6.0 | 8.4 | 0.6 | 0.4 | 2.4 | 3.4 | 122.4 |
West Wyalong Ap Annual Temperatures & Rainfall
West Wyalong Ap Average Number of Days With Temperatures
| Jan | Feb | Mar | Apr | May | Jun | Jul | Aug | Sep | Oct | Nov | Dec | Ann | |
|---|---|---|---|---|---|---|---|---|---|---|---|---|---|
| ≥ 40°C |
3.8 | 1.7 | 0.0 | 0.0 | 0.0 | 0.0 | 0.0 | 0.0 | 0.0 | 0.0 | 0.5 | 1.3 | 7.5 |
| ≥ 35°C |
14.3 | 7.9 | 2.6 | 0.1 | 0.0 | 0.0 | 0.0 | 0.0 | 0.0 | 0.7 | 3.6 | 7.4 | 37.1 |
| ≥ 30°C |
24.8 | 20.2 | 13.3 | 2.2 | 0.0 | 0.0 | 0.0 | 0.0 | 0.8 | 5.1 | 11.4 | 18.8 | 97.6 |
| ≤ 2°C |
0.0 | 0.0 | 0.0 | 0.2 | 5.4 | 10.0 | 14.1 | 12.3 | 5.5 | 0.5 | 0.0 | 0.0 | 47.0 |
| ≤ 0°C |
0.0 | 0.0 | 0.0 | 0.1 | 1.5 | 4.6 | 7.4 | 5.5 | 1.4 | 0.0 | 0.0 | 0.0 | 19.7 |
West Wyalong Ap 'per Week' Values (14th/86th Percentiles)
| Jan | Feb | Mar | Apr | May | Jun | Jul | Aug | Sep | Oct | Nov | Dec | Ann | |
|---|---|---|---|---|---|---|---|---|---|---|---|---|---|
| High Max |
39.4 | 37.2 | 33.8 | 28.4 | 22.9 | 18.0 | 17.0 | 19.0 | 25.3 | 29.6 | 34.7 | 36.0 | 33.1 |
| Low Max |
28.3 | 26.6 | 24.4 | 19.8 | 15.7 | 12.0 | 11.4 | 12.4 | 15.4 | 19.0 | 23.0 | 26.0 | 14.8 |
| High Min |
23.0 | 21.7 | 18.0 | 13.8 | 10.0 | 8.5 | 7.4 | 7.1 | 10.0 | 14.0 | 18.0 | 19.7 | 17.7 |
| Low Min |
14.0 | 14.0 | 10.6 | 6.0 | 2.0 | 0.0 | -0.5 | 0.0 | 2.0 | 4.4 | 8.6 | 11.0 | 2.2 |
West Wyalong Ap Data Availability
| Jan | Feb | Mar | Apr | May | Jun | Jul | Aug | Sep | Oct | Nov | Dec | Ann | |
|---|---|---|---|---|---|---|---|---|---|---|---|---|---|
| Years of Minima |
25 | 25 | 24 | 24 | 25 | 25 | 24 | 24 | 25 | 25 | 25 | 25 | 24.0 |
| Earliest Entry |
2000 | 2000 | 2000 | 1999 | 1999 | 1999 | 1999 | 1999 | 1999 | 1999 | 1999 | 1999 | 1999 |
| Latest Entry |
2024 | 2024 | 2024 | 2023 | 2023 | 2023 | 2023 | 2023 | 2023 | 2023 | 2023 | 2023 | 2024 |
| Years of Maxima |
25 | 25 | 24 | 24 | 25 | 25 | 25 | 24 | 25 | 25 | 25 | 25 | 24.0 |
| Earliest Entry |
2000 | 2000 | 2000 | 1999 | 1999 | 1999 | 1999 | 1999 | 1999 | 1999 | 1999 | 1999 | 1999 |
| Latest Entry |
2024 | 2024 | 2024 | 2023 | 2023 | 2023 | 2023 | 2023 | 2023 | 2023 | 2023 | 2023 | 2024 |
| Years of Rainfall |
25 | 25 | 24 | 24 | 25 | 25 | 24 | 24 | 25 | 25 | 25 | 25 | 24.0 |
| Earliest Entry |
2000 | 2000 | 2000 | 1999 | 1999 | 1999 | 1999 | 1999 | 1999 | 1999 | 1999 | 1999 | 1999 |
| Latest Entry |
2024 | 2024 | 2024 | 2023 | 2023 | 2023 | 2023 | 2023 | 2023 | 2023 | 2023 | 2023 | 2024 |
Station Details
WEST WYALONG AIRPORT AWS
CW Slopes & Plains, New South Wales/ACT
CW Slopes & Plains, New South Wales/ACT
33.9382°S 147.1962°E
257m AMSL
Commenced 1999
Commenced 1999
Enter a postcode or town name for local weather, or text to search the site. » advanced search
Winter is Coming: Chilly day for Sydney, rain pelts eastern seaboard
17:22 AEST Just as we forecast yesterday, a coastal trough has deepened along the NSW and southeast Qld coasts as a low in the Coral Sea continues to inch closer to Qld. The trough has brought some interesting weather to NSW in the past 36 hours or so, particularly along the coastal fringe, giving those New South Welshmen a “Stark” Game of Thrones reminder: winter is coming.
- 11:54 AEST We need to talk about drainage
- 11:48 AEST A very wet weekend for southeast Qld, northeast NSW
- 10:07 AEST Southerly surges across the southeast
- 13:20 AEST Generation gone with the wind