- WEATHER
Australia
- National
- New South Wales
- Victoria
- Queensland
- Western Australia
- South Australia
- Tasmania
- ACT
- Northern Territory
Long Range Forecasts
- WARNINGS
- RADAR
- SATELLITE
- MAPS & CHARTS
- LONG RANGE
Long Range Forecasts
- CLIMATE
Climate Indicators
- NEWS
Moss Vale Long-term Averages
| Jan | Feb | Mar | Apr | May | Jun | Jul | Aug | Sep | Oct | Nov | Dec | Ann | |
|---|---|---|---|---|---|---|---|---|---|---|---|---|---|
| Mean Max (°C) |
26.0 | 24.2 | 22.0 | 19.1 | 15.4 | 12.5 | 12.0 | 13.4 | 16.9 | 19.6 | 22.0 | 24.2 | 18.9 |
| Mean Min (°C) |
14.3 | 13.9 | 12.1 | 8.7 | 4.8 | 3.5 | 2.5 | 3.0 | 5.4 | 7.9 | 10.5 | 12.2 | 8.1 |
| Mean Rain (mm) |
66.3 | 106.2 | 95.3 | 61.7 | 47.0 | 74.1 | 60.0 | 54.1 | 40.0 | 52.5 | 75.1 | 62.8 | 788.9 |
| Median Rain (mm) |
49.2 | 110.6 | 52.0 | 34.8 | 30.8 | 35.4 | 28.0 | 22.4 | 31.4 | 49.1 | 58.1 | 56.0 | 556.8 |
| Mean Rain Days |
13.8 | 15.0 | 16.0 | 16.4 | 15.0 | 16.8 | 13.7 | 12.4 | 11.3 | 12.1 | 14.1 | 12.5 | 167.0 |
Moss Vale Daily Records
| Jan | Feb | Mar | Apr | May | Jun | Jul | Aug | Sep | Oct | Nov | Dec | Ann | |
|---|---|---|---|---|---|---|---|---|---|---|---|---|---|
| High Max (°C) |
40.9 | 41.2 | 37.0 | 30.7 | 23.4 | 20.3 | 21.4 | 22.5 | 30.4 | 31.7 | 37.9 | 41.1 | 41.2 |
| Low Max (°C) |
13.7 | 14.0 | 11.2 | 10.0 | 8.4 | 5.7 | 5.1 | 6.0 | 8.3 | 8.7 | 9.0 | 11.0 | 5.1 |
| High Min (°C) |
25.7 | 24.2 | 19.0 | 17.1 | 14.9 | 12.0 | 11.3 | 14.1 | 17.4 | 18.0 | 23.4 | 24.0 | 25.7 |
| Low Min (°C) |
4.1 | 5.7 | 2.2 | -2.5 | -3.4 | -6.3 | -5.7 | -5.4 | -4.0 | -2.0 | -0.1 | 2.0 | -6.3 |
| High Rain (mm) |
66.0 | 107.8 | 89.8 | 131.0 | 71.2 | 135.8 | 165.4 | 109.4 | 41.6 | 56.0 | 86.4 | 86.8 | 165.4 |
Moss Vale Monthly Records
| Jan | Feb | Mar | Apr | May | Jun | Jul | Aug | Sep | Oct | Nov | Dec | Ann | |
|---|---|---|---|---|---|---|---|---|---|---|---|---|---|
| High Mn. Max (°C) |
29.9 | 27.1 | 24.6 | 22.6 | 17.2 | 14.3 | 14.4 | 15.3 | 20.1 | 21.8 | 26.1 | 27.9 | 20.5 |
| Low Mn. Max (°C) |
23.3 | 21.2 | 19.8 | 17.0 | 14.1 | 10.7 | 10.9 | 11.3 | 14.9 | 16.5 | 18.6 | 18.9 | 17.4 |
| High Mn. Min (°C) |
17.2 | 15.3 | 14.3 | 10.6 | 6.8 | 6.4 | 4.3 | 5.5 | 6.9 | 9.9 | 11.9 | 14.4 | 9.0 |
| Low Mn. Min (°C) |
12.7 | 12.5 | 10.0 | 6.0 | 2.8 | 1.0 | 0.3 | 1.3 | 3.9 | 6.1 | 8.4 | 9.9 | 6.7 |
| High Rain (mm) |
139.4 | 277.6 | 418.6 | 211.2 | 184.2 | 318.0 | 392.2 | 217.8 | 156.6 | 147.2 | 176.2 | 142.8 | 1857.8 |
| Low Rain (mm) |
12.4 | 6.4 | 19.8 | 5.4 | 4.8 | 7.6 | 1.4 | 4.4 | 1.4 | 1.6 | 11.0 | 3.6 | 389.8 |
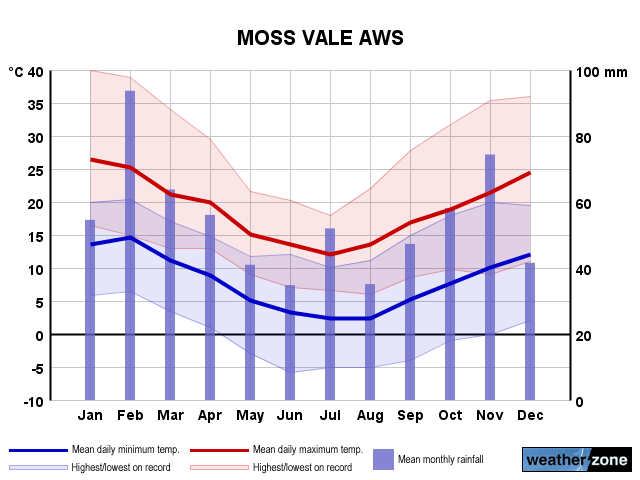
Moss Vale Annual Temperatures & Rainfall
Moss Vale Average Number of Days With Temperatures
| Jan | Feb | Mar | Apr | May | Jun | Jul | Aug | Sep | Oct | Nov | Dec | Ann | |
|---|---|---|---|---|---|---|---|---|---|---|---|---|---|
| ≥ 40°C |
0.1 | 0.0 | 0.0 | 0.0 | 0.0 | 0.0 | 0.0 | 0.0 | 0.0 | 0.0 | 0.0 | 0.0 | 0.2 |
| ≥ 35°C |
2.4 | 0.9 | 0.0 | 0.0 | 0.0 | 0.0 | 0.0 | 0.0 | 0.0 | 0.0 | 0.4 | 0.8 | 4.3 |
| ≥ 30°C |
7.9 | 3.8 | 1.1 | 0.1 | 0.0 | 0.0 | 0.0 | 0.0 | 0.0 | 0.4 | 2.6 | 4.8 | 20.2 |
| ≤ 2°C |
0.0 | 0.0 | 0.0 | 1.3 | 7.7 | 9.9 | 13.2 | 11.3 | 5.6 | 1.7 | 0.2 | 0.0 | 50.8 |
| ≤ 0°C |
0.0 | 0.0 | 0.0 | 0.2 | 3.7 | 6.2 | 7.3 | 6.4 | 2.5 | 0.4 | 0.0 | 0.0 | 26.9 |
Moss Vale 'per Week' Values (14th/86th Percentiles)
| Jan | Feb | Mar | Apr | May | Jun | Jul | Aug | Sep | Oct | Nov | Dec | Ann | |
|---|---|---|---|---|---|---|---|---|---|---|---|---|---|
| High Max |
32.5 | 29.6 | 27.0 | 23.4 | 18.8 | 16.0 | 14.2 | 17.0 | 21.4 | 25.0 | 28.3 | 29.7 | 26.0 |
| Low Max |
20.7 | 18.7 | 17.3 | 15.0 | 12.0 | 10.0 | 9.3 | 9.8 | 12.3 | 14.2 | 15.2 | 18.2 | 11.9 |
| High Min |
16.9 | 16.9 | 14.8 | 12.0 | 9.0 | 7.5 | 6.0 | 6.6 | 9.1 | 11.6 | 14.0 | 15.0 | 14.0 |
| Low Min |
10.4 | 11.0 | 7.5 | 3.7 | 0.6 | -1.0 | -1.9 | -1.6 | 1.0 | 4.0 | 6.4 | 8.8 | 1.8 |
Moss Vale Data Availability
| Jan | Feb | Mar | Apr | May | Jun | Jul | Aug | Sep | Oct | Nov | Dec | Ann | |
|---|---|---|---|---|---|---|---|---|---|---|---|---|---|
| Years of Minima |
22 | 23 | 24 | 22 | 23 | 23 | 23 | 23 | 22 | 23 | 23 | 22 | 23.0 |
| Earliest Entry |
2002 | 2001 | 2001 | 2001 | 2001 | 2001 | 2001 | 2001 | 2001 | 2001 | 2001 | 2001 | 2001 |
| Latest Entry |
2024 | 2024 | 2024 | 2024 | 2023 | 2023 | 2023 | 2023 | 2023 | 2023 | 2023 | 2023 | 2024 |
| Years of Maxima |
22 | 23 | 24 | 22 | 23 | 23 | 23 | 23 | 22 | 23 | 23 | 22 | 23.0 |
| Earliest Entry |
2002 | 2001 | 2001 | 2001 | 2001 | 2001 | 2001 | 2001 | 2001 | 2001 | 2001 | 2001 | 2001 |
| Latest Entry |
2024 | 2024 | 2024 | 2024 | 2023 | 2023 | 2023 | 2023 | 2023 | 2023 | 2023 | 2023 | 2024 |
| Years of Rainfall |
22 | 23 | 24 | 22 | 23 | 23 | 23 | 23 | 22 | 23 | 23 | 22 | 23.0 |
| Earliest Entry |
2002 | 2001 | 2001 | 2001 | 2001 | 2001 | 2001 | 2001 | 2001 | 2001 | 2001 | 2001 | 2001 |
| Latest Entry |
2024 | 2024 | 2024 | 2024 | 2023 | 2023 | 2023 | 2023 | 2023 | 2023 | 2023 | 2023 | 2024 |
Station Details
MOSS VALE AWS
Illawarra, New South Wales/ACT
Illawarra, New South Wales/ACT
34.5253°S 150.4217°E
679m AMSL
Commenced 2001
Commenced 2001
Enter a postcode or town name for local weather, or text to search the site. » advanced search
Satellites capture huge dust storm crossing Mediterranean Sea
14:32 AEST Images captured from satellites have revealed the colossal scale of a dust storm that turned the sky orange in parts of Greece earlier this week.
- 08:00 AEST A digger's letter from snowbound Gallipoli
- 15:39 AEST Summery Sydney, wintry Melbourne
- 13:00 AEST Rainfall to soak some parched areas of WA
- 10:33 AEST Tassie snow, Melbourne temps go low