- WEATHER
Australia
- National
- New South Wales
- Victoria
- Queensland
- Western Australia
- South Australia
- Tasmania
- ACT
- Northern Territory
Long Range Forecasts
- WARNINGS
- RADAR
- SATELLITE
- MAPS & CHARTS
- LONG RANGE
Long Range Forecasts
- CLIMATE
Climate Indicators
- NEWS
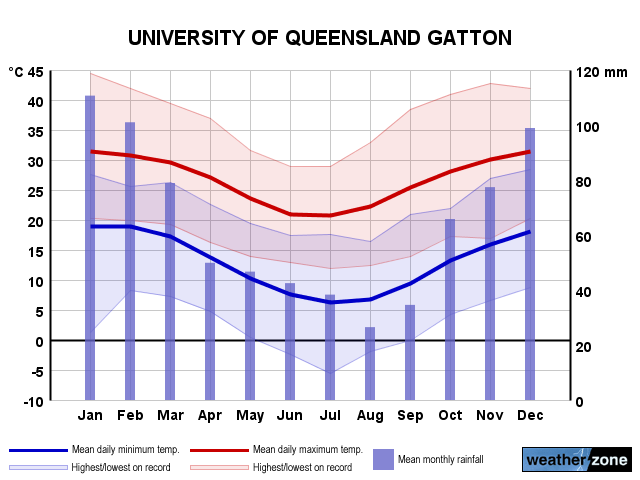
Gatton Long-term Averages
| Jan | Feb | Mar | Apr | May | Jun | Jul | Aug | Sep | Oct | Nov | Dec | Ann | |
|---|---|---|---|---|---|---|---|---|---|---|---|---|---|
| Mean Max (°C) |
31.8 | 31.0 | 29.8 | 27.4 | 24.0 | 21.4 | 21.0 | 22.8 | 26.0 | 28.3 | 30.1 | 31.3 | 27.0 |
| Mean Min (°C) |
19.4 | 19.2 | 17.6 | 13.9 | 10.5 | 7.9 | 6.4 | 6.9 | 9.8 | 13.3 | 16.0 | 18.3 | 13.2 |
| Mean Rain (mm) |
110.8 | 98.6 | 79.5 | 47.8 | 45.4 | 40.9 | 36.5 | 25.9 | 34.5 | 65.3 | 78.8 | 98.8 | 761.8 |
| Median Rain (mm) |
93.9 | 84.5 | 67.6 | 35.7 | 27.3 | 26.1 | 28.8 | 20.8 | 28.4 | 50.1 | 72.3 | 82.9 | 761.8 |
| Mean Rain Days |
10.1 | 9.9 | 10.0 | 6.7 | 6.5 | 5.8 | 5.6 | 5.1 | 5.4 | 7.8 | 8.4 | 9.6 | 90.6 |
Gatton Daily Records
| Jan | Feb | Mar | Apr | May | Jun | Jul | Aug | Sep | Oct | Nov | Dec | Ann | |
|---|---|---|---|---|---|---|---|---|---|---|---|---|---|
| High Max (°C) |
44.5 | 45.7 | 41.1 | 37.4 | 33.7 | 31.5 | 29.0 | 37.9 | 39.5 | 41.6 | 42.8 | 43.5 | 45.7 |
| Low Max (°C) |
20.2 | 19.6 | 19.2 | 16.3 | 13.9 | 11.8 | 12.0 | 12.5 | 14.0 | 17.3 | 17.0 | 19.0 | 11.8 |
| High Min (°C) |
27.6 | 27.3 | 26.2 | 22.6 | 19.5 | 17.4 | 17.6 | 18.1 | 20.9 | 21.9 | 27.0 | 28.5 | 28.5 |
| Low Min (°C) |
11.9 | 8.3 | 6.7 | 3.2 | -0.2 | -2.4 | -5.6 | -1.9 | 0.0 | 4.3 | 6.3 | 8.8 | -5.6 |
| High Rain (mm) |
199.4 | 182.0 | 141.5 | 110.1 | 118.9 | 111.5 | 192.3 | 46.2 | 71.4 | 107.2 | 170.6 | 108.8 | 199.4 |
Gatton Monthly Records
| Jan | Feb | Mar | Apr | May | Jun | Jul | Aug | Sep | Oct | Nov | Dec | Ann | |
|---|---|---|---|---|---|---|---|---|---|---|---|---|---|
| High Mn. Max (°C) |
35.2 | 35.1 | 33.7 | 29.9 | 27.5 | 23.8 | 23.6 | 26.6 | 30.0 | 32.0 | 35.0 | 35.7 | 29.6 |
| Low Mn. Max (°C) |
28.0 | 27.2 | 26.6 | 25.2 | 21.4 | 19.4 | 18.5 | 19.9 | 22.2 | 25.0 | 26.7 | 27.8 | 25.5 |
| High Mn. Min (°C) |
21.7 | 21.9 | 19.8 | 16.7 | 14.3 | 13.1 | 10.9 | 10.6 | 13.4 | 16.6 | 18.5 | 20.4 | 14.8 |
| Low Mn. Min (°C) |
16.7 | 17.2 | 14.1 | 10.7 | 7.0 | 4.4 | 2.6 | 3.7 | 7.0 | 10.6 | 13.6 | 15.8 | 12.2 |
| High Rain (mm) |
452.9 | 307.3 | 323.4 | 324.1 | 443.5 | 319.6 | 306.4 | 94.8 | 190.5 | 269.0 | 321.2 | 317.0 | 1241.4 |
| Low Rain (mm) |
1.2 | 0.0 | 0.8 | 0.0 | 0.0 | 0.0 | 0.0 | 0.0 | 0.0 | 0.0 | 0.8 | 1.3 | 230.0 |
Gatton Annual Temperatures & Rainfall
Gatton Average Number of Days With Temperatures
| Jan | Feb | Mar | Apr | May | Jun | Jul | Aug | Sep | Oct | Nov | Dec | Ann | |
|---|---|---|---|---|---|---|---|---|---|---|---|---|---|
| ≥ 40°C |
0.4 | 0.2 | 0.1 | 0.0 | 0.0 | 0.0 | 0.0 | 0.0 | 0.0 | 0.1 | 0.3 | 0.4 | 1.5 |
| ≥ 35°C |
5.1 | 3.0 | 1.4 | 0.2 | 0.0 | 0.0 | 0.0 | 0.0 | 0.3 | 1.6 | 3.5 | 4.6 | 19.6 |
| ≥ 30°C |
22.0 | 17.7 | 14.8 | 4.9 | 0.3 | 0.0 | 0.0 | 0.4 | 4.0 | 10.1 | 14.5 | 20.0 | 107.6 |
| ≤ 2°C |
0.0 | 0.0 | 0.0 | 0.0 | 0.1 | 1.2 | 3.6 | 1.9 | 0.1 | 0.0 | 0.0 | 0.0 | 6.8 |
| ≤ 0°C |
0.0 | 0.0 | 0.0 | 0.0 | 0.0 | 0.2 | 1.1 | 0.2 | 0.0 | 0.0 | 0.0 | 0.0 | 1.5 |
Gatton 'per Week' Values (14th/86th Percentiles)
| Jan | Feb | Mar | Apr | May | Jun | Jul | Aug | Sep | Oct | Nov | Dec | Ann | |
|---|---|---|---|---|---|---|---|---|---|---|---|---|---|
| High Max |
35.0 | 34.0 | 32.5 | 30.3 | 26.4 | 23.8 | 23.4 | 25.3 | 29.6 | 32.0 | 34.0 | 35.0 | 32.2 |
| Low Max |
28.3 | 27.7 | 26.9 | 24.7 | 21.4 | 18.9 | 18.1 | 19.7 | 22.2 | 24.0 | 25.6 | 27.2 | 21.4 |
| High Min |
22.2 | 22.0 | 20.2 | 17.4 | 15.0 | 11.9 | 10.4 | 11.0 | 13.9 | 17.0 | 19.4 | 21.4 | 19.6 |
| Low Min |
16.4 | 16.6 | 14.6 | 11.0 | 6.7 | 4.1 | 2.4 | 3.4 | 6.0 | 9.6 | 12.5 | 15.2 | 6.3 |
Gatton Data Availability
| Jan | Feb | Mar | Apr | May | Jun | Jul | Aug | Sep | Oct | Nov | Dec | Ann | |
|---|---|---|---|---|---|---|---|---|---|---|---|---|---|
| Years of Minima |
60 | 60 | 59 | 58 | 58 | 58 | 59 | 58 | 59 | 59 | 59 | 59 | 59.0 |
| Earliest Entry |
1965 | 1965 | 1965 | 1965 | 1965 | 1965 | 1965 | 1965 | 1965 | 1965 | 1965 | 1965 | 1965 |
| Latest Entry |
2024 | 2024 | 2024 | 2024 | 2023 | 2023 | 2023 | 2023 | 2023 | 2023 | 2023 | 2023 | 2024 |
| Years of Maxima |
60 | 60 | 59 | 57 | 57 | 58 | 59 | 58 | 58 | 57 | 59 | 58 | 59.0 |
| Earliest Entry |
1965 | 1965 | 1965 | 1965 | 1965 | 1965 | 1965 | 1965 | 1965 | 1965 | 1965 | 1965 | 1965 |
| Latest Entry |
2024 | 2024 | 2024 | 2024 | 2023 | 2023 | 2023 | 2023 | 2023 | 2023 | 2023 | 2023 | 2024 |
| Years of Rainfall |
126 | 127 | 126 | 124 | 124 | 125 | 123 | 125 | 127 | 127 | 127 | 126 | 124.0 |
| Earliest Entry |
1899 | 1898 | 1898 | 1899 | 1899 | 1899 | 1899 | 1897 | 1897 | 1897 | 1897 | 1898 | 1897 |
| Latest Entry |
2024 | 2024 | 2024 | 2024 | 2023 | 2023 | 2023 | 2023 | 2023 | 2023 | 2023 | 2023 | 2024 |
Station Details
UNIVERSITY OF QUEENSLAND GATTON
Southeast Coast, Queensland
Southeast Coast, Queensland
27.5436°S 152.3375°E
89m AMSL
Commenced 1897
Commenced 1897
Enter a postcode or town name for local weather, or text to search the site. » advanced search
Satellites capture huge dust storm crossing Mediterranean Sea
14:32 AEST Images captured from satellites have revealed the colossal scale of a dust storm that turned the sky orange in parts of Greece earlier this week.
- 08:00 AEST A digger's letter from snowbound Gallipoli
- 15:39 AEST Summery Sydney, wintry Melbourne
- 13:00 AEST Rainfall to soak some parched areas of WA
- 10:33 AEST Tassie snow, Melbourne temps go low