- WEATHER
Australia
- National
- New South Wales
- Victoria
- Queensland
- Western Australia
- South Australia
- Tasmania
- ACT
- Northern Territory
Long Range Forecasts
- WARNINGS
- RADAR
- SATELLITE
- MAPS & CHARTS
- LONG RANGE
Long Range Forecasts
- CLIMATE
Climate Indicators
- NEWS
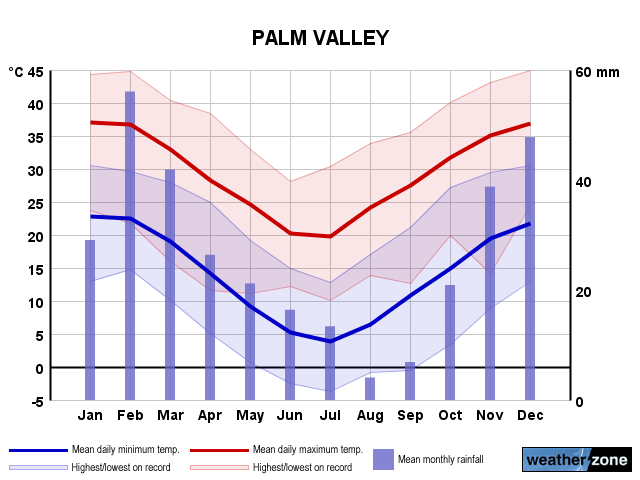
Palm Valley Long-term Averages
| Jan | Feb | Mar | Apr | May | Jun | Jul | Aug | Sep | Oct | Nov | Dec | Ann | |
|---|---|---|---|---|---|---|---|---|---|---|---|---|---|
| Mean Max (°C) |
37.1 | 36.5 | 32.7 | 28.1 | 24.3 | 20.3 | 19.9 | 23.8 | 27.9 | 32.1 | 34.5 | 36.5 | 29.4 |
| Mean Min (°C) |
22.8 | 22.2 | 19.6 | 14.1 | 9.8 | 5.5 | 3.8 | 6.1 | 10.7 | 15.3 | 19.4 | 21.6 | 14.1 |
| Mean Rain (mm) |
38.7 | 44.3 | 38.7 | 22.2 | 18.8 | 14.0 | 13.3 | 5.1 | 9.0 | 20.4 | 44.3 | 42.1 | 309.0 |
| Median Rain (mm) |
11.0 | 16.2 | 9.6 | 1.4 | 4.8 | 3.6 | 3.2 | 1.8 | 3.2 | 11.4 | 28.1 | 27.4 | 264.8 |
| Mean Rain Days |
4.5 | 4.1 | 3.4 | 2.1 | 2.4 | 2.4 | 2.0 | 1.5 | 2.3 | 3.5 | 5.7 | 6.0 | 39.9 |
Palm Valley Daily Records
| Jan | Feb | Mar | Apr | May | Jun | Jul | Aug | Sep | Oct | Nov | Dec | Ann | |
|---|---|---|---|---|---|---|---|---|---|---|---|---|---|
| High Max (°C) |
44.6 | 44.8 | 44.0 | 38.4 | 33.0 | 28.1 | 30.4 | 33.9 | 39.4 | 41.6 | 43.1 | 44.9 | 44.9 |
| Low Max (°C) |
23.1 | 21.7 | 16.0 | 11.6 | 11.2 | 7.4 | 10.1 | 12.7 | 12.7 | 19.9 | 14.2 | 24.4 | 7.4 |
| High Min (°C) |
30.5 | 29.6 | 28.2 | 25.0 | 19.2 | 18.6 | 13.4 | 17.1 | 21.1 | 28.0 | 29.4 | 30.9 | 30.9 |
| Low Min (°C) |
12.9 | 14.7 | 10.1 | 5.1 | 0.7 | -2.8 | -3.7 | -0.8 | -0.6 | 3.4 | 8.9 | 13.0 | -3.7 |
| High Rain (mm) |
81.4 | 124.2 | 132.0 | 81.4 | 64.7 | 35.2 | 40.8 | 35.2 | 36.8 | 42.2 | 115.8 | 96.6 | 132.0 |
Palm Valley Monthly Records
| Jan | Feb | Mar | Apr | May | Jun | Jul | Aug | Sep | Oct | Nov | Dec | Ann | |
|---|---|---|---|---|---|---|---|---|---|---|---|---|---|
| High Mn. Max (°C) |
38.8 | 40.1 | 36.8 | 30.7 | 26.6 | 22.2 | 21.8 | 25.6 | 30.5 | 34.4 | 36.9 | 38.1 | 29.8 |
| Low Mn. Max (°C) |
32.8 | 33.5 | 29.1 | 25.0 | 22.8 | 18.9 | 17.3 | 21.6 | 25.2 | 30.7 | 32.2 | 33.6 | 28.8 |
| High Mn. Min (°C) |
24.4 | 23.6 | 21.1 | 16.1 | 12.5 | 7.6 | 6.7 | 7.5 | 12.5 | 17.7 | 22.5 | 22.7 | 15.2 |
| Low Mn. Min (°C) |
19.0 | 21.0 | 17.8 | 11.4 | 7.2 | 3.8 | 2.4 | 4.3 | 9.6 | 12.0 | 17.2 | 21.0 | 12.7 |
| High Rain (mm) |
184.4 | 471.8 | 211.1 | 341.4 | 131.1 | 63.2 | 109.2 | 37.6 | 101.1 | 87.1 | 193.2 | 212.8 | 1084.8 |
| Low Rain (mm) |
0.0 | 0.0 | 0.0 | 0.0 | 0.0 | 0.0 | 0.0 | 0.0 | 0.0 | 0.0 | 0.0 | 0.0 | 32.1 |
Palm Valley Annual Temperatures & Rainfall
Palm Valley Average Number of Days With Temperatures
| Jan | Feb | Mar | Apr | May | Jun | Jul | Aug | Sep | Oct | Nov | Dec | Ann | |
|---|---|---|---|---|---|---|---|---|---|---|---|---|---|
| ≥ 40°C |
8.8 | 4.3 | 0.6 | 0.0 | 0.0 | 0.0 | 0.0 | 0.0 | 0.0 | 0.2 | 3.1 | 6.1 | 23.2 |
| ≥ 35°C |
20.9 | 19.7 | 11.7 | 2.3 | 0.0 | 0.0 | 0.0 | 0.0 | 1.1 | 9.2 | 14.4 | 20.4 | 98.1 |
| ≥ 30°C |
27.1 | 25.7 | 22.9 | 11.1 | 1.9 | 0.0 | 0.1 | 2.8 | 10.6 | 19.4 | 24.6 | 28.0 | 167.6 |
| ≤ 2°C |
0.0 | 0.0 | 0.0 | 0.0 | 0.9 | 5.1 | 10.9 | 4.8 | 0.5 | 0.0 | 0.0 | 0.0 | 23.2 |
| ≤ 0°C |
0.0 | 0.0 | 0.0 | 0.0 | 0.0 | 2.2 | 5.4 | 1.0 | 0.1 | 0.0 | 0.0 | 0.0 | 9.5 |
Palm Valley 'per Week' Values (14th/86th Percentiles)
| Jan | Feb | Mar | Apr | May | Jun | Jul | Aug | Sep | Oct | Nov | Dec | Ann | |
|---|---|---|---|---|---|---|---|---|---|---|---|---|---|
| High Max |
41.8 | 40.1 | 38.4 | 32.7 | 28.5 | 24.4 | 24.8 | 28.6 | 33.1 | 37.4 | 39.6 | 41.0 | 38.4 |
| Low Max |
32.5 | 32.0 | 27.4 | 23.2 | 19.9 | 16.5 | 15.6 | 18.7 | 22.7 | 26.9 | 29.7 | 31.9 | 20.3 |
| High Min |
26.4 | 26.4 | 23.5 | 18.0 | 14.0 | 9.6 | 8.3 | 10.7 | 15.2 | 20.0 | 24.0 | 25.7 | 22.9 |
| Low Min |
18.8 | 18.2 | 15.2 | 10.0 | 5.7 | 1.4 | -0.5 | 1.7 | 5.5 | 10.7 | 14.9 | 17.5 | 4.5 |
Palm Valley Data Availability
| Jan | Feb | Mar | Apr | May | Jun | Jul | Aug | Sep | Oct | Nov | Dec | Ann | |
|---|---|---|---|---|---|---|---|---|---|---|---|---|---|
| Years of Minima |
8 | 9 | 8 | 7 | 8 | 9 | 9 | 9 | 8 | 8 | 9 | 8 | 8.0 |
| Earliest Entry |
1982 | 1982 | 1982 | 1982 | 1981 | 1981 | 1981 | 1981 | 1981 | 1981 | 1981 | 1981 | 1981 |
| Latest Entry |
1990 | 1990 | 1990 | 1989 | 1989 | 1989 | 1989 | 1989 | 1989 | 1989 | 1989 | 1989 | 1990 |
| Years of Maxima |
8 | 9 | 7 | 7 | 8 | 9 | 9 | 9 | 8 | 8 | 9 | 7 | 8.0 |
| Earliest Entry |
1982 | 1982 | 1982 | 1982 | 1981 | 1981 | 1981 | 1981 | 1981 | 1981 | 1981 | 1981 | 1981 |
| Latest Entry |
1990 | 1990 | 1990 | 1989 | 1989 | 1989 | 1989 | 1989 | 1989 | 1989 | 1989 | 1989 | 1990 |
| Years of Rainfall |
43 | 43 | 42 | 42 | 42 | 43 | 43 | 42 | 42 | 42 | 41 | 42 | 41.0 |
| Earliest Entry |
1982 | 1982 | 1982 | 1982 | 1981 | 1981 | 1981 | 1981 | 1981 | 1981 | 1981 | 1981 | 1981 |
| Latest Entry |
2024 | 2024 | 2024 | 2023 | 2023 | 2023 | 2023 | 2023 | 2023 | 2023 | 2023 | 2023 | 2024 |
Station Details
PALM VALLEY
Alice Springs, Northern Territory
Alice Springs, Northern Territory
24.0637°S 132.7448°E
520m AMSL
Commenced 1981
Commenced 1981
Enter a postcode or town name for local weather, or text to search the site. » advanced search
500km line of storms sweeping across the Goldfields,WA
12:04 AEST Over 32 thousand lightning strikes hit the Kalgoorlie region on Sunday and Monday, with more rainfall to come at the end of this week for the state’s southwest. The image below shows a 500km line of thunderstorms stretching between Leinster and Salmon Gums on Monday morning as the sun rises. Image: Himawari-9 satellite images for the three hours leading up to 8:20am AWST on Monday, May 6.
- 11:28 AEST Rain every day this week in NSW
- 14:40 AEST Intense Rainfall: Over 100mm in just 3 days over NSW
- 14:36 AEST Riverina's first rain in a month frustrates some, drenches others
- 11:55 AEST Spooky spectre sighting west of Sydney