- WEATHER
Australia
- National
- New South Wales
- Victoria
- Queensland
- Western Australia
- South Australia
- Tasmania
- ACT
- Northern Territory
Long Range Forecasts
- WARNINGS
- RADAR
- SATELLITE
- MAPS & CHARTS
- LONG RANGE
Long Range Forecasts
- CLIMATE
Climate Indicators
- NEWS
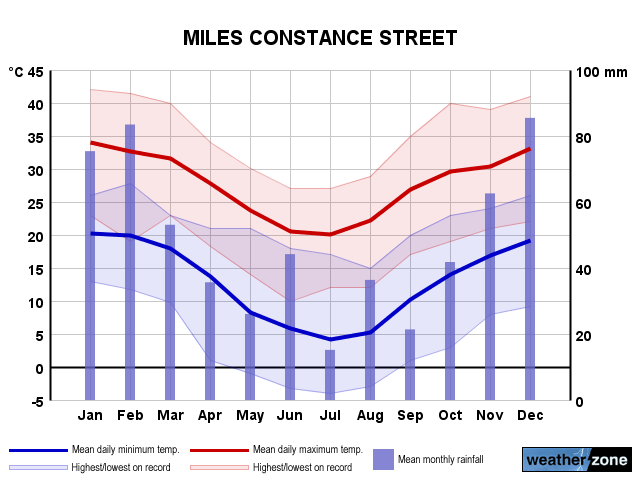
Miles Long-term Averages
| Jan | Feb | Mar | Apr | May | Jun | Jul | Aug | Sep | Oct | Nov | Dec | Ann | |
|---|---|---|---|---|---|---|---|---|---|---|---|---|---|
| Mean Max (°C) |
33.9 | 32.9 | 31.3 | 27.9 | 23.7 | 20.5 | 20.4 | 22.8 | 26.6 | 29.6 | 31.4 | 33.0 | 27.8 |
| Mean Min (°C) |
20.6 | 20.0 | 18.1 | 13.3 | 8.0 | 5.8 | 4.4 | 5.3 | 10.0 | 13.9 | 17.0 | 19.1 | 12.9 |
| Mean Rain (mm) |
69.5 | 75.5 | 67.8 | 23.8 | 29.3 | 36.1 | 22.2 | 29.3 | 29.8 | 47.8 | 57.5 | 86.4 | 567.3 |
| Median Rain (mm) |
46.1 | 63.2 | 37.2 | 12.0 | 21.0 | 31.4 | 13.5 | 12.2 | 19.8 | 30.8 | 46.2 | 74.4 | 548.6 |
| Mean Rain Days |
7.6 | 7.6 | 6.7 | 4.4 | 5.6 | 6.1 | 5.4 | 4.3 | 5.0 | 6.9 | 8.3 | 8.8 | 76.1 |
Miles Daily Records
| Jan | Feb | Mar | Apr | May | Jun | Jul | Aug | Sep | Oct | Nov | Dec | Ann | |
|---|---|---|---|---|---|---|---|---|---|---|---|---|---|
| High Max (°C) |
43.2 | 43.4 | 41.4 | 34.6 | 33.0 | 31.2 | 32.9 | 36.2 | 39.9 | 40.7 | 42.6 | 43.8 | 43.8 |
| Low Max (°C) |
20.3 | 19.0 | 19.5 | 14.8 | 11.3 | 8.9 | 10.5 | 12.0 | 13.4 | 16.0 | 20.9 | 17.1 | 8.9 |
| High Min (°C) |
26.6 | 27.8 | 25.2 | 24.0 | 21.0 | 18.0 | 17.7 | 20.5 | 20.7 | 23.0 | 25.9 | 26.0 | 27.8 |
| Low Min (°C) |
11.4 | 11.8 | 4.3 | 0.1 | -2.6 | -4.0 | -4.8 | -3.8 | -1.0 | 1.4 | 3.4 | 8.0 | -4.8 |
| High Rain (mm) |
96.4 | 116.0 | 82.6 | 77.0 | 62.0 | 45.4 | 54.0 | 73.0 | 52.4 | 78.4 | 78.0 | 99.2 | 116.0 |
Miles Monthly Records
| Jan | Feb | Mar | Apr | May | Jun | Jul | Aug | Sep | Oct | Nov | Dec | Ann | |
|---|---|---|---|---|---|---|---|---|---|---|---|---|---|
| High Mn. Max (°C) |
36.1 | 36.4 | 33.9 | 30.6 | 26.2 | 23.3 | 22.7 | 26.9 | 31.0 | 31.6 | 35.0 | 37.2 | 29.4 |
| Low Mn. Max (°C) |
30.8 | 29.9 | 28.8 | 25.9 | 21.7 | 16.8 | 18.2 | 20.5 | 23.4 | 26.3 | 27.4 | 28.3 | 25.9 |
| High Mn. Min (°C) |
22.6 | 21.7 | 20.0 | 15.4 | 13.2 | 8.5 | 7.9 | 8.7 | 13.1 | 16.6 | 19.6 | 20.8 | 14.0 |
| Low Mn. Min (°C) |
18.2 | 18.3 | 14.8 | 9.6 | 4.4 | 3.5 | 0.1 | 3.0 | 7.7 | 11.5 | 14.0 | 16.1 | 11.9 |
| High Rain (mm) |
194.8 | 246.8 | 167.6 | 128.4 | 146.8 | 152.8 | 98.0 | 165.0 | 165.0 | 120.8 | 224.4 | 340.0 | 1011.2 |
| Low Rain (mm) |
0.6 | 0.0 | 0.0 | 0.0 | 3.0 | 0.0 | 0.0 | 0.0 | 0.0 | 0.4 | 7.0 | 4.2 | 222.4 |
Miles Annual Temperatures & Rainfall
Miles Average Number of Days With Temperatures
| Jan | Feb | Mar | Apr | May | Jun | Jul | Aug | Sep | Oct | Nov | Dec | Ann | |
|---|---|---|---|---|---|---|---|---|---|---|---|---|---|
| ≥ 40°C |
0.9 | 0.7 | 0.1 | 0.0 | 0.0 | 0.0 | 0.0 | 0.0 | 0.0 | 0.1 | 0.3 | 1.0 | 3.1 |
| ≥ 35°C |
12.6 | 8.2 | 3.6 | 0.0 | 0.0 | 0.0 | 0.0 | 0.1 | 0.6 | 2.6 | 5.8 | 9.8 | 42.7 |
| ≥ 30°C |
27.1 | 24.0 | 22.3 | 7.2 | 0.3 | 0.0 | 0.1 | 0.6 | 6.3 | 15.3 | 19.4 | 25.1 | 147.4 |
| ≤ 2°C |
0.0 | 0.0 | 0.0 | 0.2 | 3.2 | 7.5 | 11.0 | 9.1 | 1.4 | 0.0 | 0.0 | 0.0 | 32.0 |
| ≤ 0°C |
0.0 | 0.0 | 0.0 | 0.0 | 0.7 | 3.6 | 6.4 | 4.4 | 0.1 | 0.0 | 0.0 | 0.0 | 15.0 |
Miles 'per Week' Values (14th/86th Percentiles)
| Jan | Feb | Mar | Apr | May | Jun | Jul | Aug | Sep | Oct | Nov | Dec | Ann | |
|---|---|---|---|---|---|---|---|---|---|---|---|---|---|
| High Max |
37.3 | 36.0 | 34.0 | 30.9 | 27.0 | 24.0 | 23.0 | 26.0 | 31.0 | 33.7 | 35.0 | 37.0 | 34.0 |
| Low Max |
30.9 | 29.1 | 29.0 | 25.0 | 21.0 | 16.6 | 16.5 | 18.8 | 22.2 | 25.1 | 27.0 | 29.2 | 21.0 |
| High Min |
23.0 | 22.8 | 21.0 | 17.8 | 13.2 | 11.9 | 10.0 | 11.4 | 15.5 | 18.0 | 20.4 | 22.1 | 20.4 |
| Low Min |
18.0 | 17.0 | 14.9 | 9.8 | 2.8 | 0.0 | -1.0 | 0.0 | 5.0 | 9.1 | 13.6 | 16.0 | 4.0 |
Miles Data Availability
| Jan | Feb | Mar | Apr | May | Jun | Jul | Aug | Sep | Oct | Nov | Dec | Ann | |
|---|---|---|---|---|---|---|---|---|---|---|---|---|---|
| Years of Minima |
27 | 27 | 27 | 26 | 25 | 25 | 26 | 27 | 27 | 27 | 27 | 27 | 26.0 |
| Earliest Entry |
1998 | 1998 | 1998 | 1998 | 1998 | 1998 | 1997 | 1997 | 1997 | 1997 | 1997 | 1997 | 1997 |
| Latest Entry |
2024 | 2024 | 2024 | 2024 | 2023 | 2023 | 2023 | 2023 | 2023 | 2023 | 2023 | 2023 | 2024 |
| Years of Maxima |
27 | 27 | 27 | 26 | 25 | 25 | 26 | 27 | 27 | 27 | 27 | 27 | 26.0 |
| Earliest Entry |
1998 | 1998 | 1998 | 1998 | 1998 | 1998 | 1997 | 1997 | 1997 | 1997 | 1997 | 1997 | 1997 |
| Latest Entry |
2024 | 2024 | 2024 | 2024 | 2023 | 2023 | 2023 | 2023 | 2023 | 2023 | 2023 | 2023 | 2024 |
| Years of Rainfall |
27 | 26 | 26 | 25 | 23 | 24 | 26 | 27 | 27 | 27 | 27 | 27 | 25.0 |
| Earliest Entry |
1998 | 1998 | 1998 | 1998 | 1998 | 1998 | 1997 | 1997 | 1997 | 1997 | 1997 | 1997 | 1997 |
| Latest Entry |
2024 | 2024 | 2024 | 2024 | 2023 | 2023 | 2023 | 2023 | 2023 | 2023 | 2023 | 2023 | 2024 |
Station Details
MILES CONSTANCE STREET
Darling Downs, Queensland
Darling Downs, Queensland
26.6569°S 150.1819°E
305m AMSL
Commenced 1997
Commenced 1997
Enter a postcode or town name for local weather, or text to search the site. » advanced search
Bonsoy Gold Coast Pro surf forecast
07:00 AEST After an emotional mid-year cut at the Margaret River Pro surf competition in Western Australia last week, surfers that fell below the cut line, along with up-and-coming talent, will be battling it out on the Gold Coast from this weekend onwards. The first stop on the Challenger Series (the lesser format of the Championship Tour) will take place along the Gold Coast’s premier surf point breaks, starting this morning and running to Saturday May 4th.