- WEATHER
Australia
- National
- New South Wales
- Victoria
- Queensland
- Western Australia
- South Australia
- Tasmania
- ACT
- Northern Territory
Long Range Forecasts
- WARNINGS
- RADAR
- SATELLITE
- MAPS & CHARTS
- LONG RANGE
Long Range Forecasts
- CLIMATE
Climate Indicators
- NEWS
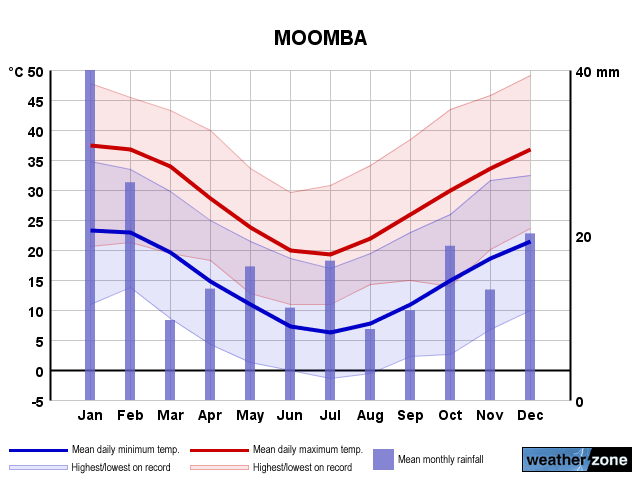
Moomba Long-term Averages
| Jan | Feb | Mar | Apr | May | Jun | Jul | Aug | Sep | Oct | Nov | Dec | Ann | |
|---|---|---|---|---|---|---|---|---|---|---|---|---|---|
| Mean Max (°C) |
37.4 | 36.7 | 34.0 | 28.6 | 23.7 | 19.9 | 19.2 | 22.0 | 26.0 | 29.9 | 33.7 | 36.7 | 29.0 |
| Mean Min (°C) |
23.2 | 23.0 | 19.6 | 14.8 | 10.9 | 7.3 | 6.3 | 7.7 | 11.0 | 15.0 | 18.6 | 21.5 | 14.9 |
| Mean Rain (mm) |
40.0 | 26.4 | 9.8 | 13.5 | 16.2 | 11.2 | 16.9 | 8.6 | 10.9 | 18.7 | 13.5 | 20.2 | 206.3 |
| Median Rain (mm) |
8.4 | 6.1 | 2.0 | 1.8 | 5.8 | 5.8 | 8.2 | 3.0 | 2.2 | 11.4 | 9.4 | 4.5 | 163.0 |
| Mean Rain Days |
3.3 | 3.2 | 1.7 | 2.1 | 2.8 | 2.4 | 3.0 | 2.2 | 2.4 | 3.6 | 3.4 | 2.9 | 31.3 |
Moomba Daily Records
| Jan | Feb | Mar | Apr | May | Jun | Jul | Aug | Sep | Oct | Nov | Dec | Ann | |
|---|---|---|---|---|---|---|---|---|---|---|---|---|---|
| High Max (°C) |
47.8 | 45.4 | 43.2 | 39.9 | 33.6 | 29.6 | 30.7 | 34.1 | 38.4 | 43.5 | 45.8 | 49.1 | 49.1 |
| Low Max (°C) |
20.6 | 21.3 | 19.5 | 18.3 | 12.8 | 11.0 | 11.0 | 14.2 | 14.9 | 14.0 | 20.1 | 23.6 | 11.0 |
| High Min (°C) |
34.8 | 33.4 | 29.8 | 24.9 | 21.5 | 18.6 | 16.9 | 19.4 | 23.0 | 26.0 | 31.6 | 32.5 | 34.8 |
| Low Min (°C) |
10.9 | 13.8 | 8.6 | 4.2 | 1.2 | 0.0 | -1.4 | -0.5 | 2.3 | 2.6 | 6.7 | 10.0 | -1.4 |
| High Rain (mm) |
136.8 | 78.2 | 94.4 | 36.2 | 58.2 | 34.0 | 52.0 | 19.4 | 58.6 | 49.0 | 34.4 | 80.5 | 136.8 |
Moomba Monthly Records
| Jan | Feb | Mar | Apr | May | Jun | Jul | Aug | Sep | Oct | Nov | Dec | Ann | |
|---|---|---|---|---|---|---|---|---|---|---|---|---|---|
| High Mn. Max (°C) |
41.0 | 40.7 | 37.7 | 31.8 | 26.5 | 22.6 | 21.7 | 25.9 | 29.3 | 34.1 | 36.9 | 40.4 | 30.3 |
| Low Mn. Max (°C) |
32.4 | 32.4 | 30.6 | 26.2 | 20.7 | 17.5 | 16.8 | 19.4 | 22.7 | 26.1 | 30.9 | 34.1 | 27.3 |
| High Mn. Min (°C) |
26.0 | 26.8 | 22.6 | 17.0 | 13.2 | 10.3 | 9.1 | 10.5 | 13.5 | 16.7 | 20.4 | 24.2 | 15.8 |
| Low Mn. Min (°C) |
17.7 | 20.4 | 16.5 | 12.5 | 8.4 | 4.8 | 4.3 | 5.5 | 8.3 | 12.1 | 15.6 | 18.5 | 13.2 |
| High Rain (mm) |
439.4 | 161.6 | 94.4 | 109.5 | 87.2 | 47.9 | 89.2 | 42.0 | 113.2 | 79.0 | 39.4 | 173.8 | 869.2 |
| Low Rain (mm) |
0.0 | 0.0 | 0.0 | 0.0 | 0.0 | 0.0 | 0.0 | 0.0 | 0.0 | 0.0 | 0.0 | 0.0 | 44.9 |
Moomba Annual Temperatures & Rainfall
Moomba Average Number of Days With Temperatures
| Jan | Feb | Mar | Apr | May | Jun | Jul | Aug | Sep | Oct | Nov | Dec | Ann | |
|---|---|---|---|---|---|---|---|---|---|---|---|---|---|
| ≥ 40°C |
9.8 | 6.7 | 2.1 | 0.0 | 0.0 | 0.0 | 0.0 | 0.0 | 0.0 | 0.9 | 3.1 | 8.3 | 29.7 |
| ≥ 35°C |
22.8 | 19.3 | 13.5 | 1.9 | 0.0 | 0.0 | 0.0 | 0.0 | 1.2 | 5.5 | 12.2 | 19.7 | 92.4 |
| ≥ 30°C |
28.0 | 26.0 | 25.2 | 11.9 | 1.7 | 0.0 | 0.0 | 1.3 | 6.4 | 14.9 | 21.4 | 27.9 | 158.3 |
| ≤ 2°C |
0.0 | 0.0 | 0.0 | 0.0 | 0.1 | 1.0 | 2.0 | 0.4 | 0.0 | 0.0 | 0.0 | 0.0 | 3.3 |
| ≤ 0°C |
0.0 | 0.0 | 0.0 | 0.0 | 0.0 | 0.0 | 0.2 | 0.0 | 0.0 | 0.0 | 0.0 | 0.0 | 0.2 |
Moomba 'per Week' Values (14th/86th Percentiles)
| Jan | Feb | Mar | Apr | May | Jun | Jul | Aug | Sep | Oct | Nov | Dec | Ann | |
|---|---|---|---|---|---|---|---|---|---|---|---|---|---|
| High Max |
42.2 | 41.2 | 38.5 | 33.4 | 28.0 | 23.6 | 23.0 | 26.7 | 31.7 | 35.5 | 39.5 | 42.0 | 38.4 |
| Low Max |
32.2 | 31.8 | 29.4 | 23.8 | 19.7 | 16.5 | 15.8 | 17.8 | 20.7 | 24.4 | 28.1 | 31.5 | 19.6 |
| High Min |
27.3 | 26.7 | 23.9 | 19.1 | 14.9 | 11.2 | 10.0 | 11.9 | 15.7 | 19.5 | 23.4 | 25.9 | 23.3 |
| Low Min |
19.1 | 19.0 | 15.5 | 10.4 | 6.9 | 3.9 | 3.0 | 4.2 | 7.0 | 10.7 | 14.0 | 17.1 | 6.5 |
Moomba Data Availability
| Jan | Feb | Mar | Apr | May | Jun | Jul | Aug | Sep | Oct | Nov | Dec | Ann | |
|---|---|---|---|---|---|---|---|---|---|---|---|---|---|
| Years of Minima |
27 | 27 | 27 | 27 | 27 | 27 | 26 | 26 | 26 | 26 | 26 | 27 | 26.3 |
| Earliest Entry |
1973 | 1973 | 1973 | 1973 | 1973 | 1973 | 1973 | 1973 | 1973 | 1973 | 1972 | 1972 | 1972 |
| Latest Entry |
1999 | 1999 | 1999 | 1999 | 1999 | 1999 | 1998 | 1998 | 1998 | 1998 | 1998 | 1998 | 1999 |
| Years of Maxima |
27 | 27 | 27 | 27 | 27 | 27 | 26 | 26 | 26 | 26 | 26 | 27 | 26.3 |
| Earliest Entry |
1973 | 1973 | 1973 | 1973 | 1973 | 1973 | 1973 | 1973 | 1973 | 1973 | 1972 | 1972 | 1972 |
| Latest Entry |
1999 | 1999 | 1999 | 1999 | 1999 | 1999 | 1998 | 1998 | 1998 | 1998 | 1998 | 1998 | 1999 |
| Years of Rainfall |
32 | 33 | 33 | 32 | 32 | 32 | 32 | 32 | 32 | 32 | 32 | 33 | 32.2 |
| Earliest Entry |
1973 | 1973 | 1973 | 1973 | 1973 | 1973 | 1973 | 1973 | 1973 | 1973 | 1972 | 1972 | 1972 |
| Latest Entry |
2005 | 2005 | 2005 | 2004 | 2004 | 2004 | 2004 | 2004 | 2004 | 2004 | 2004 | 2004 | 2005 |
Station Details
MOOMBA
NE Pastoral, South Australia
NE Pastoral, South Australia
28.1125°S 140.2102°E
39m AMSL
Commenced 1972 / Closed 2005
Commenced 1972 / Closed 2005
Enter a postcode or town name for local weather, or text to search the site. » advanced search
Wet start to the Olympics... will the rain continue?
14:05 AEST The Paris 2024 Summer Olympics opening ceremony was quite the unique spectacle.
- 16:04 AEST Snowy weekend ahead in the mountains
- 13:42 AEST Perth's first wetter-than-average month in more than a year
- 13:13 AEST Prolonged cold outbreak for southeastern Australia
- 14:03 AEST A stormy taste of spring for NSW and Qld