- WEATHER
Australia
- National
- New South Wales
- Victoria
- Queensland
- Western Australia
- South Australia
- Tasmania
- ACT
- Northern Territory
Long Range Forecasts
- WARNINGS
- RADAR
- SATELLITE
- MAPS & CHARTS
- LONG RANGE
Long Range Forecasts
- CLIMATE
Climate Indicators
- NEWS
Cocos Island Ap Long-term Averages
| Jan | Feb | Mar | Apr | May | Jun | Jul | Aug | Sep | Oct | Nov | Dec | Ann | |
|---|---|---|---|---|---|---|---|---|---|---|---|---|---|
| Mean Max (°C) |
29.8 | 30.0 | 30.1 | 29.9 | 29.3 | 28.6 | 28.1 | 28.1 | 28.3 | 28.7 | 29.1 | 29.4 | 29.1 |
| Mean Min (°C) |
24.9 | 25.1 | 25.3 | 25.3 | 25.2 | 24.6 | 24.1 | 24.0 | 24.0 | 24.3 | 24.5 | 24.6 | 24.6 |
| Mean Rain (mm) |
162.4 | 195.1 | 236.8 | 242.4 | 190.6 | 216.0 | 208.3 | 120.6 | 92.6 | 81.4 | 97.1 | 118.9 | 1955.1 |
| Median Rain (mm) |
134.1 | 171.4 | 215.8 | 216.2 | 166.0 | 191.8 | 176.2 | 93.7 | 47.9 | 45.6 | 59.5 | 77.2 | 1883.6 |
| Mean Rain Days |
12.8 | 14.5 | 17.3 | 17.7 | 17.9 | 18.5 | 19.6 | 16.8 | 13.3 | 10.7 | 10.5 | 11.3 | 179.6 |
Cocos Island Ap Daily Records
| Jan | Feb | Mar | Apr | May | Jun | Jul | Aug | Sep | Oct | Nov | Dec | Ann | |
|---|---|---|---|---|---|---|---|---|---|---|---|---|---|
| High Max (°C) |
32.7 | 32.8 | 32.7 | 32.8 | 32.6 | 32.0 | 31.6 | 30.6 | 30.2 | 31.0 | 32.1 | 32.2 | 32.8 |
| Low Max (°C) |
25.0 | 26.6 | 26.4 | 26.1 | 25.1 | 24.4 | 23.9 | 24.3 | 25.1 | 25.2 | 24.8 | 24.9 | 23.9 |
| High Min (°C) |
27.6 | 28.1 | 28.4 | 28.6 | 28.1 | 27.7 | 27.3 | 26.8 | 27.3 | 27.4 | 27.0 | 27.1 | 28.6 |
| Low Min (°C) |
21.0 | 20.1 | 19.8 | 19.6 | 19.4 | 20.1 | 20.4 | 18.3 | 19.0 | 20.6 | 19.3 | 20.4 | 18.3 |
| High Rain (mm) |
203.6 | 416.0 | 216.4 | 218.4 | 168.2 | 195.4 | 259.3 | 287.5 | 244.9 | 322.6 | 202.4 | 269.2 | 416.0 |
Cocos Island Ap Monthly Records
| Jan | Feb | Mar | Apr | May | Jun | Jul | Aug | Sep | Oct | Nov | Dec | Ann | |
|---|---|---|---|---|---|---|---|---|---|---|---|---|---|
| High Mn. Max (°C) |
31.1 | 31.6 | 31.3 | 31.5 | 30.4 | 29.7 | 29.2 | 29.2 | 29.5 | 30.1 | 30.0 | 30.5 | 29.8 |
| Low Mn. Max (°C) |
28.8 | 29.0 | 29.2 | 28.8 | 27.9 | 27.4 | 27.0 | 26.8 | 27.1 | 27.4 | 27.9 | 28.5 | 28.3 |
| High Mn. Min (°C) |
26.0 | 26.6 | 26.8 | 26.9 | 26.4 | 25.7 | 25.2 | 25.4 | 25.8 | 25.8 | 25.6 | 25.9 | 25.6 |
| Low Mn. Min (°C) |
23.5 | 23.8 | 24.2 | 24.1 | 23.8 | 22.9 | 22.8 | 22.6 | 22.5 | 23.0 | 23.0 | 23.7 | 23.7 |
| High Rain (mm) |
560.7 | 1000.4 | 714.1 | 594.6 | 646.2 | 649.8 | 886.0 | 467.9 | 862.5 | 816.6 | 573.9 | 511.9 | 3490.2 |
| Low Rain (mm) |
1.8 | 6.6 | 38.8 | 19.2 | 16.2 | 7.4 | 23.0 | 14.2 | 2.8 | 0.6 | 0.0 | 2.9 | 855.2 |
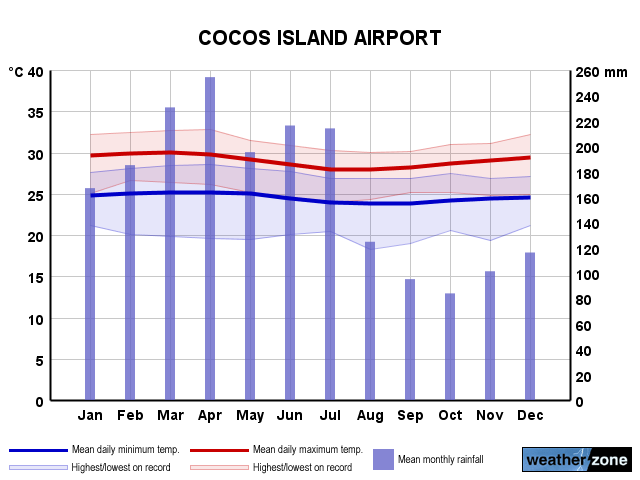
Cocos Island Ap Annual Temperatures & Rainfall
Cocos Island Ap Average Number of Days With Temperatures
| Jan | Feb | Mar | Apr | May | Jun | Jul | Aug | Sep | Oct | Nov | Dec | Ann | |
|---|---|---|---|---|---|---|---|---|---|---|---|---|---|
| ≥ 40°C |
0.0 | 0.0 | 0.0 | 0.0 | 0.0 | 0.0 | 0.0 | 0.0 | 0.0 | 0.0 | 0.0 | 0.0 | 0.0 |
| ≥ 35°C |
0.0 | 0.0 | 0.0 | 0.0 | 0.0 | 0.0 | 0.0 | 0.0 | 0.0 | 0.0 | 0.0 | 0.0 | 0.0 |
| ≥ 30°C |
14.1 | 16.1 | 17.9 | 14.7 | 6.9 | 1.8 | 0.3 | 0.1 | 0.2 | 1.1 | 3.4 | 7.8 | 83.1 |
| ≤ 2°C |
0.0 | 0.0 | 0.0 | 0.0 | 0.0 | 0.0 | 0.0 | 0.0 | 0.0 | 0.0 | 0.0 | 0.0 | 0.0 |
| ≤ 0°C |
0.0 | 0.0 | 0.0 | 0.0 | 0.0 | 0.0 | 0.0 | 0.0 | 0.0 | 0.0 | 0.0 | 0.0 | 0.0 |
Cocos Island Ap 'per Week' Values (14th/86th Percentiles)
| Jan | Feb | Mar | Apr | May | Jun | Jul | Aug | Sep | Oct | Nov | Dec | Ann | |
|---|---|---|---|---|---|---|---|---|---|---|---|---|---|
| High Max |
30.6 | 30.9 | 30.9 | 30.6 | 30.1 | 29.5 | 28.9 | 28.9 | 29.0 | 29.4 | 29.8 | 30.1 | 30.2 |
| Low Max |
28.8 | 29.0 | 29.1 | 28.9 | 28.3 | 27.6 | 27.1 | 27.2 | 27.5 | 28.0 | 28.2 | 28.7 | 27.9 |
| High Min |
25.9 | 26.2 | 26.4 | 26.5 | 26.3 | 25.7 | 25.2 | 25.1 | 25.0 | 25.1 | 25.4 | 25.6 | 25.8 |
| Low Min |
23.6 | 23.8 | 23.9 | 23.9 | 23.7 | 23.2 | 22.7 | 22.6 | 22.6 | 23.1 | 23.3 | 23.5 | 23.2 |
Cocos Island Ap Data Availability
| Jan | Feb | Mar | Apr | May | Jun | Jul | Aug | Sep | Oct | Nov | Dec | Ann | |
|---|---|---|---|---|---|---|---|---|---|---|---|---|---|
| Years of Minima |
72 | 72 | 73 | 73 | 73 | 73 | 72 | 72 | 71 | 72 | 72 | 72 | 72.0 |
| Earliest Entry |
1953 | 1952 | 1952 | 1952 | 1952 | 1952 | 1952 | 1952 | 1952 | 1952 | 1952 | 1952 | 1952 |
| Latest Entry |
2024 | 2024 | 2024 | 2024 | 2024 | 2024 | 2024 | 2023 | 2023 | 2023 | 2023 | 2023 | 2024 |
| Years of Maxima |
72 | 72 | 73 | 73 | 73 | 73 | 72 | 72 | 71 | 72 | 72 | 72 | 72.0 |
| Earliest Entry |
1953 | 1952 | 1952 | 1952 | 1952 | 1952 | 1952 | 1952 | 1952 | 1952 | 1952 | 1952 | 1952 |
| Latest Entry |
2024 | 2024 | 2024 | 2024 | 2024 | 2024 | 2024 | 2023 | 2023 | 2023 | 2023 | 2023 | 2024 |
| Years of Rainfall |
115 | 117 | 115 | 117 | 115 | 115 | 114 | 115 | 115 | 114 | 115 | 113 | 116.0 |
| Earliest Entry |
1907 | 1907 | 1907 | 1907 | 1907 | 1907 | 1907 | 1907 | 1907 | 1907 | 1907 | 1907 | 1907 |
| Latest Entry |
2024 | 2024 | 2024 | 2024 | 2024 | 2024 | 2024 | 2023 | 2023 | 2023 | 2023 | 2023 | 2024 |
Station Details
COCOS ISLAND AIRPORT
Pilbara, Western Australia
Pilbara, Western Australia
12.1892°S 96.8344°E
3m AMSL
Commenced 1901
Commenced 1901
Enter a postcode or town name for local weather, or text to search the site. » advanced search
Snowy weekend ahead in the mountains
16:04 AEST Snowfalls last weekend were the heaviest of the 2024 winter in the alpine regions of Tasmania and mainland Australia, and more snow is coming this weekend.