- WEATHER
Australia
- National
- New South Wales
- Victoria
- Queensland
- Western Australia
- South Australia
- Tasmania
- ACT
- Northern Territory
Long Range Forecasts
- WARNINGS
- RADAR
- SATELLITE
- MAPS & CHARTS
- LONG RANGE
Long Range Forecasts
- CLIMATE
Climate Indicators
- NEWS
Trangie Long-term Averages
| Jan | Feb | Mar | Apr | May | Jun | Jul | Aug | Sep | Oct | Nov | Dec | Ann | |
|---|---|---|---|---|---|---|---|---|---|---|---|---|---|
| Mean Max (°C) |
33.8 | 32.5 | 29.5 | 25.0 | 20.2 | 16.5 | 15.8 | 17.7 | 21.2 | 25.6 | 29.0 | 32.3 | 24.9 |
| Mean Min (°C) |
19.1 | 18.7 | 15.9 | 11.5 | 7.7 | 4.8 | 3.4 | 4.2 | 6.7 | 10.5 | 14.1 | 16.9 | 11.1 |
| Mean Rain (mm) |
52.1 | 51.2 | 49.1 | 40.6 | 36.5 | 36.7 | 34.0 | 31.5 | 31.8 | 44.9 | 44.9 | 42.4 | 492.8 |
| Median Rain (mm) |
36.3 | 30.8 | 24.5 | 23.2 | 28.0 | 28.3 | 30.7 | 25.6 | 23.9 | 34.8 | 35.6 | 32.2 | 453.1 |
| Mean Rain Days |
6.0 | 5.6 | 5.8 | 5.0 | 6.4 | 8.3 | 9.1 | 7.4 | 6.2 | 7.0 | 6.3 | 5.8 | 78.4 |
Trangie Daily Records
| Jan | Feb | Mar | Apr | May | Jun | Jul | Aug | Sep | Oct | Nov | Dec | Ann | |
|---|---|---|---|---|---|---|---|---|---|---|---|---|---|
| High Max (°C) |
46.1 | 47.0 | 41.1 | 36.0 | 29.4 | 25.3 | 24.0 | 30.1 | 38.6 | 41.1 | 45.0 | 45.6 | 47.0 |
| Low Max (°C) |
19.0 | 18.4 | 16.6 | 12.2 | 9.9 | 7.5 | 6.6 | 9.6 | 10.6 | 12.8 | 13.5 | 15.0 | 6.6 |
| High Min (°C) |
31.3 | 32.5 | 25.8 | 21.3 | 18.5 | 15.0 | 14.0 | 16.5 | 22.0 | 23.3 | 27.3 | 28.5 | 32.5 |
| Low Min (°C) |
-47.3 | -14.1 | 4.0 | -1.0 | -1.7 | -5.0 | -5.4 | -8.0 | -3.5 | 0.1 | 1.6 | 6.2 | -47.3 |
| High Rain (mm) |
104.1 | 226.8 | 84.9 | 117.8 | 78.2 | 102.1 | 53.3 | 60.2 | 48.0 | 56.9 | 59.9 | 69.6 | 226.8 |
Trangie Monthly Records
| Jan | Feb | Mar | Apr | May | Jun | Jul | Aug | Sep | Oct | Nov | Dec | Ann | |
|---|---|---|---|---|---|---|---|---|---|---|---|---|---|
| High Mn. Max (°C) |
39.7 | 37.2 | 33.4 | 30.1 | 22.4 | 19.1 | 18.3 | 22.1 | 24.8 | 31.7 | 35.1 | 36.4 | 27.6 |
| Low Mn. Max (°C) |
28.0 | 27.4 | 25.7 | 21.9 | 17.1 | 14.1 | 12.7 | 14.9 | 16.3 | 20.5 | 25.5 | 28.0 | 22.9 |
| High Mn. Min (°C) |
24.6 | 21.6 | 18.8 | 15.3 | 11.1 | 8.0 | 6.7 | 6.7 | 8.8 | 13.7 | 18.9 | 19.6 | 13.1 |
| Low Mn. Min (°C) |
15.7 | 16.1 | 13.0 | 8.5 | 4.0 | 1.8 | -0.2 | 2.1 | 3.7 | 8.0 | 10.3 | 13.6 | 9.4 |
| High Rain (mm) |
197.2 | 368.8 | 246.2 | 403.5 | 177.2 | 192.6 | 98.9 | 152.6 | 131.6 | 197.3 | 229.6 | 138.2 | 1209.3 |
| Low Rain (mm) |
0.0 | 0.0 | 0.0 | 0.0 | 0.0 | 3.4 | 0.5 | 0.0 | 0.0 | 0.0 | 0.0 | 0.0 | 160.0 |
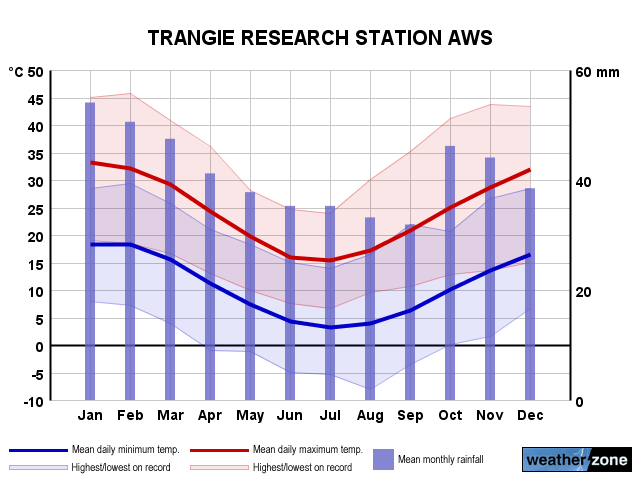
Trangie Annual Temperatures & Rainfall
Trangie Average Number of Days With Temperatures
| Jan | Feb | Mar | Apr | May | Jun | Jul | Aug | Sep | Oct | Nov | Dec | Ann | |
|---|---|---|---|---|---|---|---|---|---|---|---|---|---|
| ≥ 40°C |
2.5 | 1.1 | 0.1 | 0.0 | 0.0 | 0.0 | 0.0 | 0.0 | 0.0 | 0.0 | 0.4 | 1.1 | 5.1 |
| ≥ 35°C |
13.1 | 7.8 | 2.7 | 0.1 | 0.0 | 0.0 | 0.0 | 0.0 | 0.1 | 0.8 | 3.6 | 9.1 | 36.6 |
| ≥ 30°C |
25.0 | 20.9 | 14.9 | 2.5 | 0.0 | 0.0 | 0.0 | 0.0 | 1.0 | 5.8 | 12.5 | 21.5 | 102.7 |
| ≤ 2°C |
0.0 | 0.0 | 0.0 | 0.3 | 2.4 | 7.9 | 12.5 | 10.2 | 4.0 | 0.3 | 0.0 | 0.0 | 37.0 |
| ≤ 0°C |
0.0 | 0.0 | 0.0 | 0.1 | 0.5 | 2.8 | 6.2 | 4.3 | 0.8 | 0.0 | 0.0 | 0.0 | 14.5 |
Trangie 'per Week' Values (14th/86th Percentiles)
| Jan | Feb | Mar | Apr | May | Jun | Jul | Aug | Sep | Oct | Nov | Dec | Ann | |
|---|---|---|---|---|---|---|---|---|---|---|---|---|---|
| High Max |
38.0 | 36.9 | 33.4 | 28.6 | 23.8 | 19.6 | 18.4 | 21.0 | 26.0 | 30.2 | 34.0 | 37.0 | 33.2 |
| Low Max |
28.6 | 27.7 | 24.9 | 20.7 | 16.4 | 13.0 | 12.5 | 13.9 | 16.3 | 20.0 | 23.2 | 27.0 | 16.0 |
| High Min |
22.8 | 22.1 | 19.1 | 15.8 | 12.5 | 9.0 | 7.9 | 8.4 | 11.7 | 15.0 | 18.4 | 21.0 | 18.7 |
| Low Min |
14.7 | 15.3 | 11.4 | 7.0 | 3.2 | 0.7 | -0.7 | 0.0 | 2.0 | 5.4 | 9.0 | 12.0 | 3.0 |
Trangie Data Availability
| Jan | Feb | Mar | Apr | May | Jun | Jul | Aug | Sep | Oct | Nov | Dec | Ann | |
|---|---|---|---|---|---|---|---|---|---|---|---|---|---|
| Years of Minima |
56 | 55 | 54 | 55 | 56 | 55 | 53 | 55 | 55 | 53 | 53 | 54 | 55.0 |
| Earliest Entry |
1969 | 1969 | 1969 | 1969 | 1969 | 1969 | 1969 | 1969 | 1969 | 1969 | 1969 | 1968 | 1968 |
| Latest Entry |
2024 | 2024 | 2024 | 2024 | 2024 | 2024 | 2024 | 2024 | 2024 | 2024 | 2023 | 2023 | 2024 |
| Years of Maxima |
56 | 55 | 54 | 55 | 56 | 55 | 54 | 54 | 55 | 53 | 53 | 54 | 55.0 |
| Earliest Entry |
1969 | 1969 | 1969 | 1969 | 1969 | 1969 | 1969 | 1969 | 1969 | 1969 | 1969 | 1968 | 1968 |
| Latest Entry |
2024 | 2024 | 2024 | 2024 | 2024 | 2024 | 2024 | 2024 | 2024 | 2024 | 2023 | 2023 | 2024 |
| Years of Rainfall |
95 | 95 | 95 | 97 | 97 | 97 | 97 | 97 | 94 | 96 | 95 | 94 | 95.0 |
| Earliest Entry |
1923 | 1923 | 1923 | 1922 | 1922 | 1922 | 1922 | 1922 | 1924 | 1922 | 1922 | 1922 | 1922 |
| Latest Entry |
2024 | 2024 | 2024 | 2024 | 2024 | 2024 | 2024 | 2024 | 2024 | 2024 | 2023 | 2023 | 2024 |
Station Details
TRANGIE RESEARCH STATION AWS
CW Slopes & Plains, New South Wales/ACT
CW Slopes & Plains, New South Wales/ACT
31.9861°S 147.9489°E
215m AMSL
Commenced 1922
Commenced 1922
Enter a postcode or town name for local weather, or text to search the site. » advanced search
Hurricane risk may ramp up again for the US election
08:11 AEDT As punters focus on the US for the looming presidential election, meteorologists will be focusing on the tropical waters nearby due to the increasing potential for a burst of severe tropical weather late in the hurricane season.
- 17:49 AEDT Perth to sizzle in extreme October heat
- 10:38 AEDT Late October snowfalls in Vic, Tas
- 17:23 AEDT NT bushfire scars visible from space
- 10:27 AEDT Severe thunderstorms to hit NSW, Qld on Thursday