- WEATHER
Australia
- National
- New South Wales
- Victoria
- Queensland
- Western Australia
- South Australia
- Tasmania
- ACT
- Northern Territory
Long Range Forecasts
- WARNINGS
- RADAR
- SATELLITE
- MAPS & CHARTS
- LONG RANGE
Long Range Forecasts
- CLIMATE
Climate Indicators
- NEWS
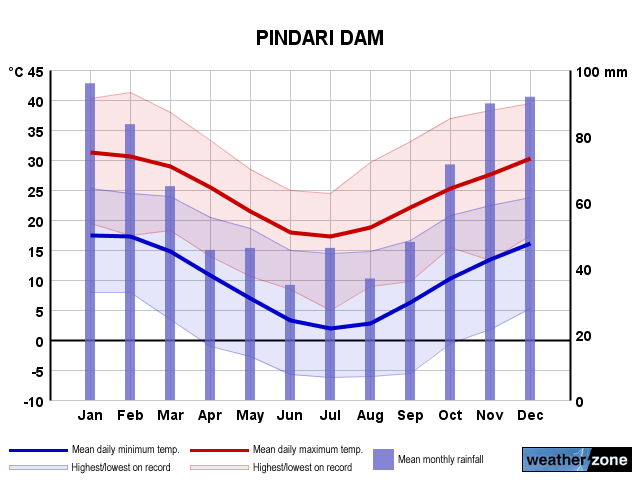
Pindari Dam Long-term Averages
| Jan | Feb | Mar | Apr | May | Jun | Jul | Aug | Sep | Oct | Nov | Dec | Ann | |
|---|---|---|---|---|---|---|---|---|---|---|---|---|---|
| Mean Max (°C) |
31.3 | 30.6 | 29.0 | 25.5 | 21.6 | 18.0 | 17.2 | 19.0 | 22.3 | 25.4 | 27.6 | 30.3 | 24.8 |
| Mean Min (°C) |
17.6 | 17.2 | 14.7 | 10.7 | 6.7 | 3.2 | 1.9 | 2.8 | 6.3 | 10.3 | 13.5 | 16.1 | 10.0 |
| Mean Rain (mm) |
90.8 | 76.6 | 64.4 | 44.5 | 41.6 | 37.5 | 40.6 | 36.8 | 45.1 | 62.7 | 85.8 | 88.5 | 735.9 |
| Median Rain (mm) |
71.8 | 78.0 | 42.1 | 38.8 | 34.2 | 32.8 | 36.3 | 31.2 | 44.7 | 53.2 | 93.8 | 96.2 | 727.2 |
| Mean Rain Days |
9.1 | 7.6 | 6.7 | 5.0 | 5.9 | 6.3 | 7.1 | 6.1 | 6.2 | 7.9 | 9.1 | 9.4 | 87.7 |
Pindari Dam Daily Records
| Jan | Feb | Mar | Apr | May | Jun | Jul | Aug | Sep | Oct | Nov | Dec | Ann | |
|---|---|---|---|---|---|---|---|---|---|---|---|---|---|
| High Max (°C) |
41.5 | 42.8 | 38.0 | 33.2 | 29.2 | 24.9 | 24.6 | 33.6 | 34.4 | 37.8 | 39.6 | 43.0 | 43.0 |
| Low Max (°C) |
19.5 | 17.5 | 18.2 | 14.0 | 10.6 | 8.5 | 5.0 | 9.0 | 9.8 | 15.3 | 13.3 | 17.4 | 5.0 |
| High Min (°C) |
25.2 | 25.0 | 23.9 | 22.0 | 18.6 | 14.9 | 15.1 | 15.5 | 17.1 | 20.7 | 23.0 | 23.7 | 25.2 |
| Low Min (°C) |
8.0 | 8.0 | 2.4 | -1.0 | -4.2 | -5.8 | -6.5 | -6.0 | -5.5 | -0.5 | 1.7 | 5.2 | -6.5 |
| High Rain (mm) |
150.0 | 160.0 | 84.0 | 72.4 | 73.6 | 81.6 | 53.4 | 52.6 | 92.6 | 78.4 | 91.0 | 61.6 | 160.0 |
Pindari Dam Monthly Records
| Jan | Feb | Mar | Apr | May | Jun | Jul | Aug | Sep | Oct | Nov | Dec | Ann | |
|---|---|---|---|---|---|---|---|---|---|---|---|---|---|
| High Mn. Max (°C) |
34.2 | 33.4 | 33.1 | 28.2 | 23.4 | 20.1 | 19.4 | 23.0 | 25.6 | 28.9 | 31.5 | 34.3 | 26.5 |
| Low Mn. Max (°C) |
28.3 | 27.5 | 25.9 | 22.6 | 20.0 | 15.3 | 14.2 | 15.5 | 19.2 | 21.5 | 24.2 | 26.9 | 23.3 |
| High Mn. Min (°C) |
19.4 | 20.2 | 17.5 | 14.1 | 10.7 | 5.6 | 6.7 | 6.8 | 9.2 | 12.5 | 15.8 | 18.0 | 12.0 |
| Low Mn. Min (°C) |
15.6 | 14.0 | 12.5 | 7.8 | 2.0 | 0.3 | -2.5 | 0.2 | 2.2 | 7.7 | 10.0 | 14.1 | 9.0 |
| High Rain (mm) |
283.7 | 248.8 | 235.2 | 216.4 | 169.6 | 108.6 | 152.2 | 100.2 | 146.0 | 175.8 | 245.6 | 186.4 | 1162.8 |
| Low Rain (mm) |
10.4 | 12.4 | 1.1 | 0.0 | 0.8 | 0.0 | 1.8 | 0.0 | 0.0 | 8.4 | 3.0 | 5.8 | 234.8 |
Pindari Dam Annual Temperatures & Rainfall
Pindari Dam Average Number of Days With Temperatures
| Jan | Feb | Mar | Apr | May | Jun | Jul | Aug | Sep | Oct | Nov | Dec | Ann | |
|---|---|---|---|---|---|---|---|---|---|---|---|---|---|
| ≥ 40°C |
0.0 | 0.1 | 0.0 | 0.0 | 0.0 | 0.0 | 0.0 | 0.0 | 0.0 | 0.0 | 0.0 | 0.0 | 0.1 |
| ≥ 35°C |
3.7 | 2.2 | 0.8 | 0.0 | 0.0 | 0.0 | 0.0 | 0.0 | 0.0 | 0.2 | 0.8 | 2.6 | 10.5 |
| ≥ 30°C |
21.6 | 17.5 | 11.3 | 1.4 | 0.0 | 0.0 | 0.0 | 0.1 | 0.6 | 3.9 | 7.9 | 17.4 | 81.9 |
| ≤ 2°C |
0.0 | 0.0 | 0.0 | 0.4 | 4.4 | 12.4 | 18.2 | 15.0 | 5.3 | 0.6 | 0.1 | 0.0 | 56.6 |
| ≤ 0°C |
0.0 | 0.0 | 0.0 | 0.1 | 1.5 | 7.3 | 12.0 | 9.1 | 1.9 | 0.0 | 0.0 | 0.0 | 32.1 |
Pindari Dam 'per Week' Values (14th/86th Percentiles)
| Jan | Feb | Mar | Apr | May | Jun | Jul | Aug | Sep | Oct | Nov | Dec | Ann | |
|---|---|---|---|---|---|---|---|---|---|---|---|---|---|
| High Max |
34.6 | 33.6 | 32.1 | 28.3 | 24.5 | 21.0 | 20.2 | 22.0 | 26.5 | 29.6 | 32.0 | 33.9 | 31.5 |
| Low Max |
28.0 | 27.4 | 26.2 | 22.9 | 18.5 | 14.5 | 13.9 | 15.5 | 18.2 | 21.5 | 23.5 | 26.4 | 18.0 |
| High Min |
20.6 | 20.2 | 18.0 | 15.0 | 11.7 | 7.8 | 7.0 | 7.9 | 11.0 | 14.6 | 17.4 | 19.5 | 17.5 |
| Low Min |
14.5 | 14.2 | 11.6 | 6.6 | 2.0 | -1.3 | -2.2 | -1.5 | 1.6 | 5.5 | 9.4 | 12.5 | 1.7 |
Pindari Dam Data Availability
| Jan | Feb | Mar | Apr | May | Jun | Jul | Aug | Sep | Oct | Nov | Dec | Ann | |
|---|---|---|---|---|---|---|---|---|---|---|---|---|---|
| Years of Minima |
38 | 38 | 38 | 38 | 37 | 37 | 37 | 38 | 39 | 37 | 37 | 39 | 37.0 |
| Earliest Entry |
1972 | 1972 | 1972 | 1972 | 1972 | 1972 | 1972 | 1971 | 1971 | 1971 | 1971 | 1971 | 1971 |
| Latest Entry |
2024 | 2024 | 2024 | 2024 | 2023 | 2023 | 2023 | 2023 | 2023 | 2023 | 2023 | 2023 | 2024 |
| Years of Maxima |
38 | 38 | 38 | 38 | 38 | 38 | 38 | 39 | 40 | 38 | 37 | 40 | 38.0 |
| Earliest Entry |
1972 | 1972 | 1972 | 1972 | 1972 | 1972 | 1972 | 1971 | 1971 | 1971 | 1971 | 1971 | 1971 |
| Latest Entry |
2024 | 2024 | 2024 | 2024 | 2023 | 2023 | 2023 | 2023 | 2023 | 2023 | 2023 | 2023 | 2024 |
| Years of Rainfall |
52 | 50 | 50 | 51 | 51 | 51 | 51 | 53 | 52 | 49 | 51 | 50 | 51.0 |
| Earliest Entry |
1972 | 1972 | 1972 | 1972 | 1972 | 1972 | 1972 | 1971 | 1971 | 1971 | 1971 | 1971 | 1971 |
| Latest Entry |
2024 | 2024 | 2024 | 2024 | 2023 | 2023 | 2023 | 2023 | 2023 | 2023 | 2023 | 2023 | 2024 |
Station Details
PINDARI DAM
NW Slopes & Plains, New South Wales/ACT
NW Slopes & Plains, New South Wales/ACT
29.3899°S 151.2448°E
462m AMSL
Commenced 1971
Commenced 1971
Enter a postcode or town name for local weather, or text to search the site. » advanced search
How severe thunderstorms impact energy infrastructure
09:23 AEST Earlier this year destructive thunderstorms and winds equivalent to a category two cyclone lashed Victoria, bending towers and toppling trees and poles. So, how can thunderstorms damage energy infrastructure, and are these events getting worse? This event occurred during mid-February 2024, when a strong cold front generated severe thunderstorms and localised wind gusts of 130km/h after a prolonged period of extreme heat.