- WEATHER
Australia
- National
- New South Wales
- Victoria
- Queensland
- Western Australia
- South Australia
- Tasmania
- ACT
- Northern Territory
Long Range Forecasts
- WARNINGS
- RADAR
- SATELLITE
- MAPS & CHARTS
- LONG RANGE
Long Range Forecasts
- CLIMATE
Climate Indicators
- NEWS
Murwillumbah Long-term Averages
| Jan | Feb | Mar | Apr | May | Jun | Jul | Aug | Sep | Oct | Nov | Dec | Ann | |
|---|---|---|---|---|---|---|---|---|---|---|---|---|---|
| Mean Max (°C) |
29.6 | 29.0 | 28.1 | 26.2 | 23.5 | 21.3 | 21.1 | 22.5 | 25.1 | 26.5 | 27.7 | 29.1 | 25.8 |
| Mean Min (°C) |
19.8 | 19.6 | 18.4 | 15.6 | 12.7 | 9.8 | 8.5 | 8.8 | 11.5 | 14.2 | 16.6 | 18.6 | 14.5 |
| Mean Rain (mm) |
212.8 | 232.5 | 218.9 | 148.0 | 131.2 | 103.0 | 64.0 | 51.2 | 42.1 | 100.9 | 118.3 | 175.5 | 1596.9 |
| Median Rain (mm) |
145.6 | 187.0 | 157.6 | 97.4 | 97.4 | 62.4 | 48.6 | 32.8 | 22.0 | 77.0 | 119.2 | 150.8 | 1475.7 |
| Mean Rain Days |
14.6 | 15.9 | 16.8 | 14.0 | 12.6 | 10.8 | 8.6 | 7.5 | 7.7 | 10.6 | 12.4 | 13.6 | 145.4 |
Murwillumbah Daily Records
| Jan | Feb | Mar | Apr | May | Jun | Jul | Aug | Sep | Oct | Nov | Dec | Ann | |
|---|---|---|---|---|---|---|---|---|---|---|---|---|---|
| High Max (°C) |
42.9 | 40.9 | 36.5 | 35.4 | 31.9 | 27.8 | 29.5 | 35.9 | 37.4 | 39.2 | 39.6 | 40.8 | 42.9 |
| Low Max (°C) |
22.1 | 21.2 | 20.3 | 17.2 | 16.3 | 13.3 | 11.8 | 13.1 | 16.6 | 17.3 | 17.5 | 18.8 | 11.8 |
| High Min (°C) |
26.8 | 26.1 | 24.0 | 22.5 | 21.7 | 18.7 | 18.4 | 18.9 | 21.1 | 22.5 | 24.5 | 25.5 | 26.8 |
| Low Min (°C) |
13.2 | 11.5 | 11.5 | 6.6 | 2.2 | -0.3 | 0.2 | -1.4 | 3.2 | 4.1 | 6.0 | 10.6 | -1.4 |
| High Rain (mm) |
231.8 | 275.0 | 321.0 | 261.4 | 203.4 | 194.0 | 154.9 | 93.1 | 98.0 | 244.3 | 108.0 | 225.4 | 321.0 |
Murwillumbah Monthly Records
| Jan | Feb | Mar | Apr | May | Jun | Jul | Aug | Sep | Oct | Nov | Dec | Ann | |
|---|---|---|---|---|---|---|---|---|---|---|---|---|---|
| High Mn. Max (°C) |
32.0 | 31.7 | 30.5 | 28.1 | 26.1 | 23.2 | 22.7 | 25.5 | 28.2 | 30.6 | 30.0 | 32.1 | 27.0 |
| Low Mn. Max (°C) |
27.0 | 26.6 | 25.9 | 24.0 | 22.2 | 20.0 | 19.7 | 20.4 | 22.9 | 23.7 | 25.5 | 26.1 | 24.8 |
| High Mn. Min (°C) |
21.3 | 21.2 | 20.1 | 17.3 | 16.8 | 11.8 | 12.6 | 11.7 | 13.9 | 17.4 | 18.8 | 21.1 | 15.4 |
| Low Mn. Min (°C) |
17.5 | 17.5 | 16.3 | 13.7 | 9.6 | 6.3 | 5.9 | 5.7 | 9.0 | 11.4 | 14.4 | 16.6 | 12.8 |
| High Rain (mm) |
820.4 | 700.5 | 764.4 | 752.4 | 543.0 | 435.7 | 430.4 | 255.0 | 157.4 | 446.2 | 353.2 | 638.7 | 2868.2 |
| Low Rain (mm) |
2.4 | 15.2 | 29.6 | 14.2 | 2.4 | 3.1 | 0.4 | 0.0 | 0.0 | 6.1 | 5.8 | 23.8 | 716.7 |
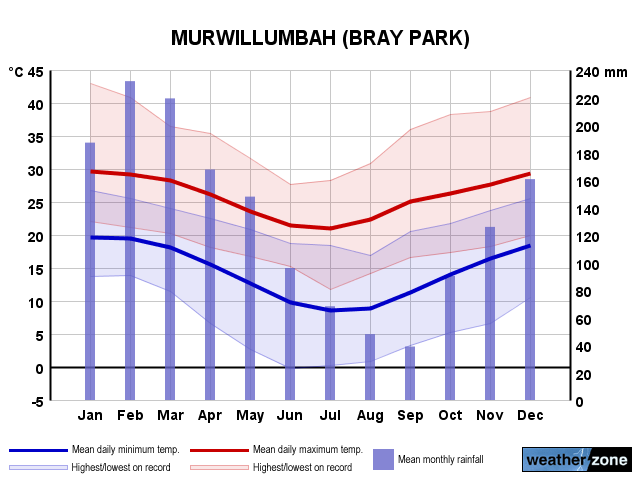
Murwillumbah Annual Temperatures & Rainfall
Murwillumbah Average Number of Days With Temperatures
| Jan | Feb | Mar | Apr | May | Jun | Jul | Aug | Sep | Oct | Nov | Dec | Ann | |
|---|---|---|---|---|---|---|---|---|---|---|---|---|---|
| ≥ 40°C |
0.1 | 0.0 | 0.0 | 0.0 | 0.0 | 0.0 | 0.0 | 0.0 | 0.0 | 0.0 | 0.0 | 0.1 | 0.2 |
| ≥ 35°C |
1.2 | 0.4 | 0.2 | 0.0 | 0.0 | 0.0 | 0.0 | 0.0 | 0.1 | 0.4 | 0.8 | 1.5 | 4.6 |
| ≥ 30°C |
12.8 | 9.3 | 7.1 | 1.8 | 0.2 | 0.0 | 0.0 | 0.2 | 2.2 | 5.3 | 7.2 | 10.9 | 56.8 |
| ≤ 2°C |
0.0 | 0.0 | 0.0 | 0.0 | 0.0 | 0.4 | 0.8 | 0.4 | 0.0 | 0.0 | 0.0 | 0.0 | 1.5 |
| ≤ 0°C |
0.0 | 0.0 | 0.0 | 0.0 | 0.0 | 0.0 | 0.0 | 0.1 | 0.0 | 0.0 | 0.0 | 0.0 | 0.1 |
Murwillumbah 'per Week' Values (14th/86th Percentiles)
| Jan | Feb | Mar | Apr | May | Jun | Jul | Aug | Sep | Oct | Nov | Dec | Ann | |
|---|---|---|---|---|---|---|---|---|---|---|---|---|---|
| High Max |
32.4 | 31.8 | 30.7 | 28.7 | 25.8 | 23.7 | 23.5 | 25.0 | 28.6 | 30.4 | 31.5 | 32.8 | 30.2 |
| Low Max |
26.8 | 26.4 | 25.3 | 23.6 | 21.2 | 19.0 | 18.7 | 19.7 | 21.8 | 22.9 | 24.0 | 25.7 | 21.2 |
| High Min |
21.9 | 21.6 | 20.3 | 18.0 | 16.0 | 13.5 | 12.5 | 12.5 | 14.8 | 17.3 | 19.3 | 21.3 | 19.7 |
| Low Min |
17.3 | 17.5 | 16.0 | 13.0 | 9.0 | 5.7 | 4.4 | 5.1 | 8.0 | 11.0 | 13.8 | 15.6 | 8.5 |
Murwillumbah Data Availability
| Jan | Feb | Mar | Apr | May | Jun | Jul | Aug | Sep | Oct | Nov | Dec | Ann | |
|---|---|---|---|---|---|---|---|---|---|---|---|---|---|
| Years of Minima |
50 | 51 | 51 | 50 | 52 | 51 | 51 | 50 | 50 | 50 | 50 | 49 | 49.0 |
| Earliest Entry |
1973 | 1973 | 1973 | 1973 | 1973 | 1973 | 1973 | 1973 | 1973 | 1972 | 1972 | 1972 | 1972 |
| Latest Entry |
2024 | 2023 | 2023 | 2024 | 2024 | 2024 | 2024 | 2023 | 2023 | 2023 | 2022 | 2021 | 2024 |
| Years of Maxima |
52 | 51 | 52 | 51 | 51 | 51 | 51 | 49 | 50 | 51 | 52 | 52 | 51.0 |
| Earliest Entry |
1973 | 1973 | 1973 | 1973 | 1973 | 1973 | 1973 | 1973 | 1973 | 1972 | 1972 | 1972 | 1972 |
| Latest Entry |
2024 | 2024 | 2024 | 2024 | 2024 | 2024 | 2024 | 2023 | 2023 | 2023 | 2023 | 2023 | 2024 |
| Years of Rainfall |
52 | 51 | 51 | 50 | 50 | 50 | 51 | 50 | 50 | 50 | 51 | 51 | 50.0 |
| Earliest Entry |
1973 | 1973 | 1973 | 1973 | 1973 | 1973 | 1973 | 1973 | 1973 | 1972 | 1972 | 1972 | 1972 |
| Latest Entry |
2024 | 2024 | 2024 | 2024 | 2024 | 2024 | 2024 | 2023 | 2023 | 2023 | 2023 | 2023 | 2024 |
Station Details
MURWILLUMBAH (BRAY PARK)
Northern Rivers, New South Wales/ACT
Northern Rivers, New South Wales/ACT
28.3395°S 153.3809°E
8m AMSL
Commenced 1972
Commenced 1972
Enter a postcode or town name for local weather, or text to search the site. » advanced search
Snowy weekend ahead in the mountains
16:04 AEST Snowfalls last weekend were the heaviest of the 2024 winter in the alpine regions of Tasmania and mainland Australia, and more snow is coming this weekend.