- WEATHER
Australia
- National
- New South Wales
- Victoria
- Queensland
- Western Australia
- South Australia
- Tasmania
- ACT
- Northern Territory
Long Range Forecasts
- WARNINGS
- RADAR
- SATELLITE
- MAPS & CHARTS
- LONG RANGE
Long Range Forecasts
- CLIMATE
Climate Indicators
- NEWS
Picton Bowling Club Long-term Averages
| Jan | Feb | Mar | Apr | May | Jun | Jul | Aug | Sep | Oct | Nov | Dec | Ann | |
|---|---|---|---|---|---|---|---|---|---|---|---|---|---|
| Mean Max (°C) |
28.0 | 27.7 | 26.5 | 23.9 | 19.9 | 17.2 | 16.9 | 17.8 | 20.7 | 23.1 | 24.9 | 27.3 | 22.8 |
| Mean Min (°C) |
15.0 | 15.3 | 13.1 | 9.0 | 5.5 | 3.6 | 1.3 | 3.1 | 5.4 | 9.1 | 11.1 | 13.6 | 8.8 |
| Mean Rain (mm) |
87.2 | 89.4 | 88.1 | 67.1 | 54.3 | 67.2 | 49.0 | 44.3 | 43.0 | 63.3 | 73.0 | 69.0 | 791.7 |
| Median Rain (mm) |
64.3 | 63.9 | 64.3 | 46.6 | 31.3 | 34.6 | 25.5 | 24.9 | 35.8 | 48.6 | 55.2 | 51.4 | 736.5 |
| Mean Rain Days |
9.1 | 9.0 | 9.4 | 7.5 | 6.7 | 7.3 | 6.4 | 6.6 | 7.0 | 8.2 | 8.5 | 8.3 | 93.8 |
Picton Bowling Club Daily Records
| Jan | Feb | Mar | Apr | May | Jun | Jul | Aug | Sep | Oct | Nov | Dec | Ann | |
|---|---|---|---|---|---|---|---|---|---|---|---|---|---|
| High Max (°C) |
40.6 | 42.8 | 39.4 | 33.1 | 27.2 | 23.8 | 25.3 | 26.9 | 34.4 | 35.6 | 38.9 | 39.6 | 42.8 |
| Low Max (°C) |
16.7 | 16.3 | 18.0 | 14.4 | 11.8 | 10.6 | 10.6 | 10.6 | 12.8 | 13.2 | 16.1 | 16.7 | 10.6 |
| High Min (°C) |
25.1 | 22.5 | 19.4 | 20.6 | 18.0 | 13.5 | 11.4 | 13.7 | 14.2 | 18.3 | 19.4 | 21.3 | 25.1 |
| Low Min (°C) |
3.3 | 7.2 | 1.7 | -2.2 | -3.3 | -4.9 | -10.0 | -4.4 | -2.8 | -0.6 | 2.2 | 4.7 | -10.0 |
| High Rain (mm) |
223.8 | 260.0 | 132.6 | 156.0 | 142.2 | 245.0 | 163.8 | 118.4 | 77.5 | 141.5 | 245.9 | 104.1 | 260.0 |
Picton Bowling Club Monthly Records
| Jan | Feb | Mar | Apr | May | Jun | Jul | Aug | Sep | Oct | Nov | Dec | Ann | |
|---|---|---|---|---|---|---|---|---|---|---|---|---|---|
| High Mn. Max (°C) |
30.6 | 30.8 | 29.4 | 26.1 | 21.2 | 18.0 | 18.5 | 19.1 | 23.3 | 25.6 | 27.3 | 29.3 | 23.7 |
| Low Mn. Max (°C) |
25.3 | 26.0 | 24.7 | 21.7 | 18.5 | 16.6 | 15.7 | 16.5 | 18.5 | 21.5 | 23.3 | 25.6 | 21.6 |
| High Mn. Min (°C) |
16.9 | 17.3 | 15.3 | 13.1 | 8.5 | 7.1 | 4.9 | 4.9 | 7.8 | 11.0 | 12.5 | 15.8 | 10.2 |
| Low Mn. Min (°C) |
13.0 | 14.2 | 11.1 | 7.5 | 3.7 | 1.3 | -2.3 | 1.1 | 3.9 | 6.8 | 9.5 | 11.1 | 7.6 |
| High Rain (mm) |
393.6 | 482.5 | 410.7 | 243.1 | 302.9 | 419.4 | 328.6 | 295.0 | 183.0 | 339.9 | 461.8 | 238.7 | 1723.2 |
| Low Rain (mm) |
0.0 | 1.0 | 1.3 | 1.1 | 0.4 | 0.0 | 0.0 | 0.0 | 0.0 | 3.1 | 1.8 | 0.8 | 303.2 |
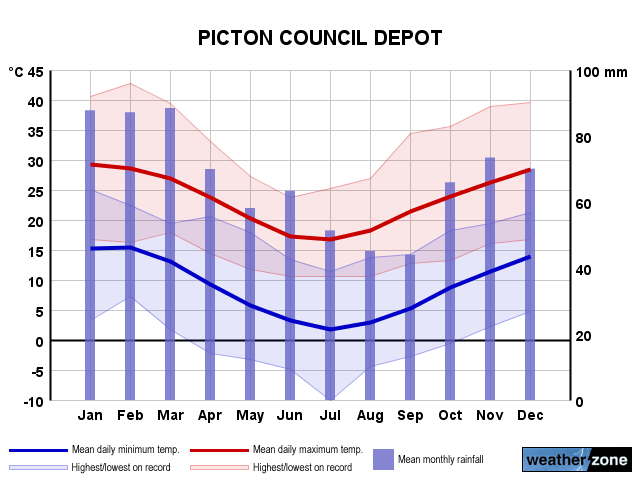
Picton Bowling Club Annual Temperatures & Rainfall
Picton Bowling Club Average Number of Days With Temperatures
| Jan | Feb | Mar | Apr | May | Jun | Jul | Aug | Sep | Oct | Nov | Dec | Ann | |
|---|---|---|---|---|---|---|---|---|---|---|---|---|---|
| ≥ 40°C |
0.2 | 0.1 | 0.0 | 0.0 | 0.0 | 0.0 | 0.0 | 0.0 | 0.0 | 0.0 | 0.0 | 0.0 | 0.3 |
| ≥ 35°C |
2.7 | 1.6 | 0.6 | 0.0 | 0.0 | 0.0 | 0.0 | 0.0 | 0.0 | 0.1 | 1.1 | 2.1 | 8.3 |
| ≥ 30°C |
10.0 | 8.3 | 5.5 | 1.0 | 0.0 | 0.0 | 0.0 | 0.0 | 0.5 | 2.7 | 4.8 | 9.6 | 42.5 |
| ≤ 2°C |
0.0 | 0.0 | 0.1 | 1.2 | 6.4 | 12.5 | 17.5 | 12.8 | 6.9 | 1.1 | 0.0 | 0.0 | 57.8 |
| ≤ 0°C |
0.0 | 0.0 | 0.0 | 0.2 | 3.0 | 7.0 | 12.9 | 6.9 | 2.2 | 0.2 | 0.0 | 0.0 | 32.1 |
Picton Bowling Club 'per Week' Values (14th/86th Percentiles)
| Jan | Feb | Mar | Apr | May | Jun | Jul | Aug | Sep | Oct | Nov | Dec | Ann | |
|---|---|---|---|---|---|---|---|---|---|---|---|---|---|
| High Max |
33.8 | 32.3 | 30.7 | 27.9 | 23.2 | 19.5 | 19.4 | 20.7 | 25.2 | 28.1 | 30.8 | 32.5 | 29.4 |
| Low Max |
22.6 | 22.8 | 22.1 | 19.8 | 16.5 | 14.9 | 14.3 | 15.1 | 16.7 | 18.0 | 19.8 | 21.7 | 16.7 |
| High Min |
18.4 | 18.3 | 16.7 | 13.7 | 10.2 | 8.9 | 5.8 | 7.2 | 9.9 | 13.0 | 14.6 | 17.2 | 15.5 |
| Low Min |
11.4 | 12.0 | 9.5 | 4.9 | 1.1 | -0.9 | -2.8 | -1.2 | 1.0 | 4.2 | 7.2 | 9.7 | 1.6 |
Picton Bowling Club Data Availability
| Jan | Feb | Mar | Apr | May | Jun | Jul | Aug | Sep | Oct | Nov | Dec | Ann | |
|---|---|---|---|---|---|---|---|---|---|---|---|---|---|
| Years of Minima |
11 | 11 | 11 | 11 | 10 | 11 | 11 | 11 | 11 | 11 | 11 | 11 | 11.0 |
| Earliest Entry |
1965 | 1965 | 1965 | 1965 | 1965 | 1965 | 1965 | 1965 | 1965 | 1965 | 1965 | 1965 | 1965 |
| Latest Entry |
1975 | 1975 | 1975 | 1975 | 1975 | 1975 | 1975 | 1975 | 1975 | 1975 | 1975 | 1975 | 1975 |
| Years of Maxima |
11 | 11 | 11 | 10 | 10 | 11 | 11 | 11 | 11 | 11 | 11 | 11 | 11.0 |
| Earliest Entry |
1965 | 1965 | 1965 | 1965 | 1965 | 1965 | 1965 | 1965 | 1965 | 1965 | 1965 | 1965 | 1965 |
| Latest Entry |
1975 | 1975 | 1975 | 1975 | 1975 | 1975 | 1975 | 1975 | 1975 | 1975 | 1975 | 1975 | 1975 |
| Years of Rainfall |
128 | 128 | 127 | 131 | 130 | 129 | 130 | 130 | 130 | 126 | 128 | 127 | 128.0 |
| Earliest Entry |
1880 | 1880 | 1880 | 1880 | 1880 | 1880 | 1880 | 1880 | 1880 | 1880 | 1880 | 1880 | 1880 |
| Latest Entry |
2020 | 2020 | 2020 | 2019 | 2019 | 2019 | 2019 | 2019 | 2019 | 2019 | 2019 | 2018 | 2020 |
Station Details
PICTON COUNCIL DEPOT
Illawarra, New South Wales/ACT
Illawarra, New South Wales/ACT
34.1685°S 150.6145°E
165m AMSL
Commenced 1880
Commenced 1880
Enter a postcode or town name for local weather, or text to search the site. » advanced search
More rain and storms for WA
13:26 AEST Days of rain and thunder are on the cards for some western and central parts of WA, with the potential for some decent falls in the region. The map below shows showers and thunderstorms approaching the Gascoyne and Upper West districts on Monday morning. Image: Himawari-9 satellite image combined with Weatherzone radar and lightning data, showing three hours of cloud, rain and lightning leading up to 10:20am on Monday, May 13. The thunderstorms and showers are forming in response to an upper-level low moving over the Indian Ocean towards the WA coastline. Image: 500 hPa temperature, wind and height at 11am AWST on Monday, May 13. The largest falls in the coming days are expected in the Gascoyne and Central West districts with widespread totals of 5 to 20mm and isolated areas of 40 to 100mm in the Gascoyne district.
- 13:03 AEST Welcome wet weather in parched western Tasmania this week
- 11:24 AEST Relief ahead for drenched NSW coast
- 11:54 AEST Aurora Australis lights up Australia
- 16:30 AEST GWM Sydney Surf Pro forecast