- WEATHER
Australia
- National
- New South Wales
- Victoria
- Queensland
- Western Australia
- South Australia
- Tasmania
- ACT
- Northern Territory
Long Range Forecasts
- WARNINGS
- RADAR
- SATELLITE
- MAPS & CHARTS
- LONG RANGE
Long Range Forecasts
- CLIMATE
Climate Indicators
- NEWS
Charlton Long-term Averages
| Jan | Feb | Mar | Apr | May | Jun | Jul | Aug | Sep | Oct | Nov | Dec | Ann | |
|---|---|---|---|---|---|---|---|---|---|---|---|---|---|
| Mean Max (°C) |
32.6 | 31.3 | 28.1 | 23.1 | 17.9 | 14.6 | 13.9 | 15.6 | 19.0 | 23.5 | 27.2 | 29.9 | 23.0 |
| Mean Min (°C) |
15.5 | 14.8 | 12.8 | 9.3 | 6.3 | 4.3 | 3.7 | 4.0 | 5.3 | 7.6 | 10.9 | 13.0 | 8.9 |
| Mean Rain (mm) |
32.3 | 15.6 | 22.8 | 29.3 | 34.1 | 35.6 | 34.1 | 36.4 | 36.4 | 32.3 | 39.1 | 33.0 | 377.6 |
| Median Rain (mm) |
17.6 | 3.2 | 15.6 | 20.0 | 18.4 | 19.4 | 35.8 | 32.6 | 32.6 | 6.8 | 37.2 | 30.2 | 332.2 |
| Mean Rain Days |
5.3 | 3.8 | 5.6 | 6.1 | 10.9 | 13.3 | 16.8 | 13.9 | 9.6 | 7.6 | 7.8 | 7.4 | 108.0 |
Charlton Daily Records
| Jan | Feb | Mar | Apr | May | Jun | Jul | Aug | Sep | Oct | Nov | Dec | Ann | |
|---|---|---|---|---|---|---|---|---|---|---|---|---|---|
| High Max (°C) |
46.5 | 46.6 | 41.2 | 38.9 | 28.1 | 22.9 | 23.7 | 26.8 | 33.9 | 37.4 | 43.8 | 45.5 | 46.6 |
| Low Max (°C) |
15.5 | 12.4 | 17.4 | 12.1 | 10.8 | 9.1 | 7.9 | 7.9 | 11.6 | 10.3 | 13.0 | 15.9 | 7.9 |
| High Min (°C) |
29.5 | 28.0 | 24.8 | 20.4 | 15.2 | 12.5 | 11.6 | 13.5 | 14.9 | 20.2 | 24.2 | 30.2 | 30.2 |
| Low Min (°C) |
6.8 | 6.3 | 3.8 | 0.5 | -2.1 | -5.8 | -4.3 | -4.2 | -2.1 | -0.9 | 0.6 | 3.2 | -5.8 |
| High Rain (mm) |
66.2 | 39.6 | 30.4 | 38.0 | 39.8 | 30.6 | 20.4 | 23.4 | 47.2 | 38.0 | 50.0 | 70.6 | 70.6 |
Charlton Monthly Records
| Jan | Feb | Mar | Apr | May | Jun | Jul | Aug | Sep | Oct | Nov | Dec | Ann | |
|---|---|---|---|---|---|---|---|---|---|---|---|---|---|
| High Mn. Max (°C) |
36.3 | 33.8 | 31.3 | 26.7 | 19.7 | 15.9 | 14.9 | 17.3 | 21.8 | 29.2 | 32.0 | 32.8 | 24.3 |
| Low Mn. Max (°C) |
30.0 | 28.0 | 25.1 | 20.1 | 16.3 | 13.2 | 12.7 | 13.6 | 16.5 | 19.9 | 22.9 | 26.6 | 21.9 |
| High Mn. Min (°C) |
18.2 | 17.0 | 15.5 | 11.4 | 9.6 | 6.5 | 5.7 | 5.6 | 7.3 | 10.6 | 14.4 | 15.6 | 9.6 |
| Low Mn. Min (°C) |
13.8 | 12.0 | 10.5 | 7.2 | 4.1 | 1.5 | 1.8 | 2.7 | 3.0 | 6.2 | 8.5 | 11.7 | 8.0 |
| High Rain (mm) |
168.6 | 54.4 | 66.2 | 119.6 | 110.2 | 81.6 | 54.0 | 99.8 | 142.0 | 173.2 | 117.4 | 105.0 | 625.8 |
| Low Rain (mm) |
0.6 | 0.0 | 0.4 | 0.2 | 4.2 | 5.8 | 2.2 | 6.0 | 3.0 | 0.0 | 4.0 | 7.8 | 215.8 |
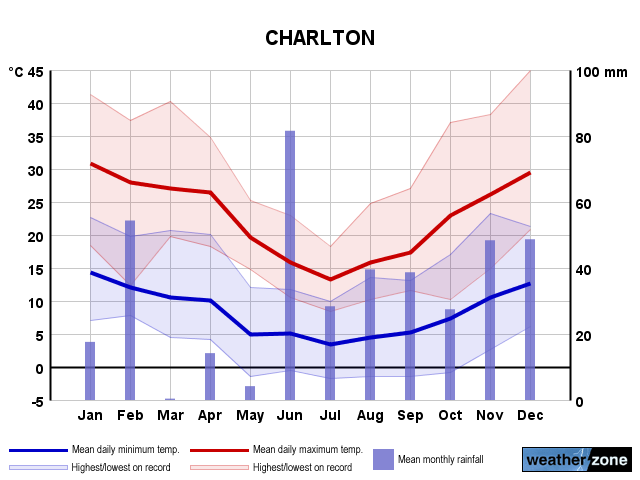
Charlton Annual Temperatures & Rainfall
Charlton Average Number of Days With Temperatures
| Jan | Feb | Mar | Apr | May | Jun | Jul | Aug | Sep | Oct | Nov | Dec | Ann | |
|---|---|---|---|---|---|---|---|---|---|---|---|---|---|
| ≥ 40°C |
2.8 | 1.2 | 0.4 | 0.0 | 0.0 | 0.0 | 0.0 | 0.0 | 0.0 | 0.0 | 0.4 | 1.4 | 6.4 |
| ≥ 35°C |
10.0 | 6.2 | 2.9 | 0.1 | 0.0 | 0.0 | 0.0 | 0.0 | 0.0 | 0.7 | 3.4 | 5.6 | 29.4 |
| ≥ 30°C |
21.1 | 16.8 | 10.1 | 1.8 | 0.0 | 0.0 | 0.0 | 0.0 | 0.4 | 4.0 | 9.4 | 14.3 | 77.7 |
| ≤ 2°C |
0.0 | 0.0 | 0.0 | 0.3 | 3.8 | 8.1 | 10.2 | 9.2 | 6.8 | 2.7 | 0.1 | 0.0 | 41.3 |
| ≤ 0°C |
0.0 | 0.0 | 0.0 | 0.0 | 0.9 | 3.7 | 4.8 | 4.0 | 2.2 | 0.2 | 0.0 | 0.0 | 15.9 |
Charlton 'per Week' Values (14th/86th Percentiles)
| Jan | Feb | Mar | Apr | May | Jun | Jul | Aug | Sep | Oct | Nov | Dec | Ann | |
|---|---|---|---|---|---|---|---|---|---|---|---|---|---|
| High Max |
37.6 | 36.4 | 34.5 | 28.3 | 21.0 | 16.9 | 15.4 | 18.8 | 22.0 | 28.8 | 35.1 | 35.1 | 32.4 |
| Low Max |
26.7 | 25.0 | 22.3 | 18.0 | 15.1 | 12.4 | 11.5 | 12.6 | 14.7 | 18.5 | 21.0 | 23.7 | 14.2 |
| High Min |
21.4 | 19.5 | 17.4 | 12.9 | 10.6 | 8.2 | 7.1 | 7.8 | 9.6 | 12.5 | 16.9 | 17.3 | 15.0 |
| Low Min |
10.4 | 9.9 | 8.3 | 4.8 | 2.2 | 0.3 | 0.3 | -0.2 | 1.2 | 2.7 | 6.7 | 8.0 | 2.5 |
Charlton Data Availability
| Jan | Feb | Mar | Apr | May | Jun | Jul | Aug | Sep | Oct | Nov | Dec | Ann | |
|---|---|---|---|---|---|---|---|---|---|---|---|---|---|
| Years of Minima |
20 | 20 | 20 | 19 | 19 | 19 | 19 | 20 | 20 | 20 | 20 | 20 | 19.0 |
| Earliest Entry |
2005 | 2005 | 2005 | 2005 | 2005 | 2005 | 2004 | 2004 | 2004 | 2004 | 2004 | 2004 | 2004 |
| Latest Entry |
2024 | 2024 | 2024 | 2024 | 2023 | 2023 | 2023 | 2023 | 2023 | 2023 | 2023 | 2023 | 2024 |
| Years of Maxima |
20 | 20 | 20 | 19 | 19 | 19 | 19 | 20 | 20 | 20 | 20 | 20 | 19.0 |
| Earliest Entry |
2005 | 2005 | 2005 | 2005 | 2005 | 2005 | 2004 | 2004 | 2004 | 2004 | 2004 | 2004 | 2004 |
| Latest Entry |
2024 | 2024 | 2024 | 2024 | 2023 | 2023 | 2023 | 2023 | 2023 | 2023 | 2023 | 2023 | 2024 |
| Years of Rainfall |
20 | 20 | 20 | 19 | 19 | 19 | 19 | 20 | 20 | 20 | 19 | 20 | 19.0 |
| Earliest Entry |
2005 | 2005 | 2005 | 2005 | 2005 | 2005 | 2004 | 2004 | 2004 | 2004 | 2004 | 2004 | 2004 |
| Latest Entry |
2024 | 2024 | 2024 | 2024 | 2023 | 2023 | 2023 | 2023 | 2023 | 2023 | 2023 | 2023 | 2024 |
Station Details
CHARLTON
Mallee, Victoria
Mallee, Victoria
36.2846°S 143.3341°E
132m AMSL
Commenced 2004
Commenced 2004
Enter a postcode or town name for local weather, or text to search the site. » advanced search
Decent rain en route to bone-dry southwest WA
14:29 AEST Welcome rain is coming to the parched southwest WA this week, possibly including Perth and Bunbury which are both having their driest 7 months on record. Many locations in the southwest will see the driest April on record, with much of this rainfall likely to contribute to May’s totals, as a cold front approaches the state on later in the week. Rainfall and thunderstorms are forecast in the Gascoyne region on Monday afternoon, before shifting to the Central West, Lower West and Central Wheatbelt regions on Tuesday.
- 12:32 AEST Wet week ahead for eastern and southwestern Australia
- 12:14 AEST A quick look at our water storages
- 16:15 AEST Signs indicating Australia's cool season arrival
- 07:00 AEST Bonsoy Gold Coast Pro surf forecast