- WEATHER
Australia
- National
- New South Wales
- Victoria
- Queensland
- Western Australia
- South Australia
- Tasmania
- ACT
- Northern Territory
Long Range Forecasts
- WARNINGS
- RADAR
- SATELLITE
- MAPS & CHARTS
- LONG RANGE
Long Range Forecasts
- CLIMATE
Climate Indicators
- NEWS
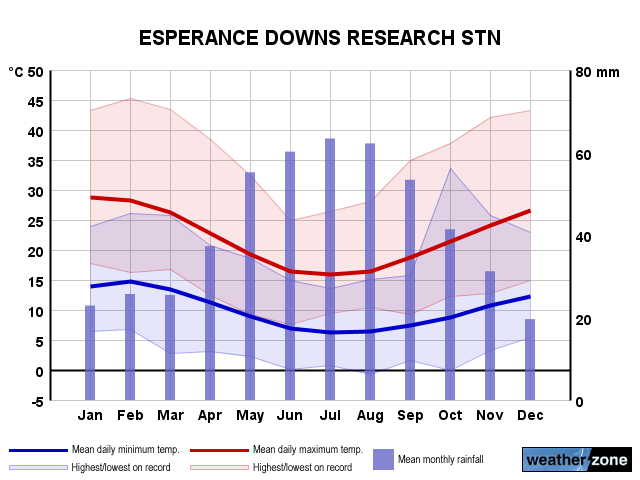
Esperance Downs Long-term Averages
| Jan | Feb | Mar | Apr | May | Jun | Jul | Aug | Sep | Oct | Nov | Dec | Ann | |
|---|---|---|---|---|---|---|---|---|---|---|---|---|---|
| Mean Max (°C) |
28.5 | 28.0 | 26.3 | 22.8 | 19.4 | 16.7 | 15.8 | 16.5 | 18.6 | 21.4 | 24.1 | 26.7 | 21.9 |
| Mean Min (°C) |
14.0 | 14.7 | 13.5 | 11.1 | 8.9 | 7.2 | 6.2 | 6.4 | 7.3 | 8.6 | 10.7 | 12.4 | 10.0 |
| Mean Rain (mm) |
28.0 | 25.6 | 27.3 | 36.8 | 53.8 | 58.6 | 62.8 | 61.1 | 52.3 | 42.3 | 31.9 | 20.3 | 501.0 |
| Median Rain (mm) |
12.9 | 14.2 | 16.8 | 31.6 | 50.0 | 54.0 | 56.7 | 58.2 | 46.6 | 39.8 | 24.5 | 13.8 | 490.0 |
| Mean Rain Days |
4.8 | 5.2 | 6.3 | 9.2 | 11.8 | 13.1 | 14.5 | 14.0 | 12.6 | 9.9 | 7.1 | 5.3 | 113.2 |
Esperance Downs Daily Records
| Jan | Feb | Mar | Apr | May | Jun | Jul | Aug | Sep | Oct | Nov | Dec | Ann | |
|---|---|---|---|---|---|---|---|---|---|---|---|---|---|
| High Max (°C) |
45.1 | 45.2 | 43.4 | 38.4 | 32.5 | 25.5 | 26.4 | 28.1 | 35.0 | 37.8 | 42.1 | 43.2 | 45.2 |
| Low Max (°C) |
16.2 | 16.1 | 14.9 | 12.1 | 9.2 | 7.6 | 8.9 | 9.7 | 9.0 | 10.6 | 12.8 | 15.0 | 7.6 |
| High Min (°C) |
24.7 | 26.1 | 25.8 | 20.8 | 18.6 | 15.0 | 13.6 | 15.3 | 17.2 | 18.3 | 25.8 | 23.0 | 26.1 |
| Low Min (°C) |
4.6 | 6.1 | 2.8 | 2.8 | 0.5 | 0.1 | 0.5 | -0.8 | 1.5 | 0.0 | 2.3 | 4.6 | -0.8 |
| High Rain (mm) |
152.0 | 78.7 | 76.4 | 59.8 | 63.4 | 65.5 | 46.2 | 38.1 | 50.8 | 55.1 | 68.8 | 40.6 | 152.0 |
Esperance Downs Monthly Records
| Jan | Feb | Mar | Apr | May | Jun | Jul | Aug | Sep | Oct | Nov | Dec | Ann | |
|---|---|---|---|---|---|---|---|---|---|---|---|---|---|
| High Mn. Max (°C) |
30.1 | 31.7 | 28.6 | 25.3 | 22.7 | 19.0 | 17.7 | 19.2 | 21.9 | 24.5 | 28.6 | 31.1 | 23.2 |
| Low Mn. Max (°C) |
25.9 | 26.1 | 24.1 | 20.1 | 16.0 | 13.9 | 14.3 | 14.9 | 16.2 | 18.3 | 20.2 | 23.2 | 20.0 |
| High Mn. Min (°C) |
15.4 | 16.9 | 15.1 | 12.6 | 9.9 | 9.4 | 7.5 | 8.6 | 9.0 | 10.2 | 13.3 | 14.7 | 11.1 |
| Low Mn. Min (°C) |
11.7 | 13.0 | 11.7 | 8.1 | 6.7 | 5.5 | 5.0 | 4.2 | 6.0 | 7.1 | 9.4 | 9.9 | 8.5 |
| High Rain (mm) |
209.0 | 165.4 | 138.2 | 131.3 | 141.7 | 154.8 | 124.5 | 148.9 | 126.8 | 115.6 | 129.4 | 69.2 | 792.6 |
| Low Rain (mm) |
0.0 | 0.2 | 0.4 | 0.8 | 3.6 | 18.0 | 14.8 | 18.0 | 12.6 | 3.0 | 0.0 | 0.0 | 259.5 |
Esperance Downs Annual Temperatures & Rainfall
Esperance Downs Average Number of Days With Temperatures
| Jan | Feb | Mar | Apr | May | Jun | Jul | Aug | Sep | Oct | Nov | Dec | Ann | |
|---|---|---|---|---|---|---|---|---|---|---|---|---|---|
| ≥ 40°C |
0.8 | 0.8 | 0.3 | 0.0 | 0.0 | 0.0 | 0.0 | 0.0 | 0.0 | 0.0 | 0.2 | 0.4 | 2.5 |
| ≥ 35°C |
5.2 | 3.9 | 1.7 | 0.2 | 0.0 | 0.0 | 0.0 | 0.0 | 0.0 | 0.2 | 1.4 | 3.2 | 15.2 |
| ≥ 30°C |
11.0 | 9.5 | 7.6 | 2.4 | 0.2 | 0.0 | 0.0 | 0.0 | 0.3 | 1.9 | 4.4 | 8.2 | 43.1 |
| ≤ 2°C |
0.0 | 0.0 | 0.0 | 0.0 | 0.1 | 0.4 | 0.5 | 0.4 | 0.3 | 0.1 | 0.0 | 0.0 | 1.8 |
| ≤ 0°C |
0.0 | 0.0 | 0.0 | 0.0 | 0.0 | 0.0 | 0.0 | 0.1 | 0.0 | 0.0 | 0.0 | 0.0 | 0.1 |
Esperance Downs 'per Week' Values (14th/86th Percentiles)
| Jan | Feb | Mar | Apr | May | Jun | Jul | Aug | Sep | Oct | Nov | Dec | Ann | |
|---|---|---|---|---|---|---|---|---|---|---|---|---|---|
| High Max |
36.1 | 35.0 | 32.2 | 28.1 | 23.1 | 19.6 | 18.3 | 19.6 | 23.2 | 27.3 | 30.1 | 33.7 | 29.4 |
| Low Max |
22.5 | 21.9 | 20.8 | 17.9 | 15.8 | 13.8 | 13.3 | 13.4 | 14.4 | 16.1 | 18.5 | 20.6 | 15.4 |
| High Min |
17.2 | 17.9 | 16.7 | 14.5 | 11.6 | 10.0 | 8.5 | 8.7 | 10.0 | 11.7 | 13.7 | 15.8 | 14.8 |
| Low Min |
10.6 | 11.0 | 10.0 | 8.0 | 6.1 | 4.5 | 3.8 | 4.0 | 4.6 | 5.3 | 7.4 | 9.0 | 5.6 |
Esperance Downs Data Availability
| Jan | Feb | Mar | Apr | May | Jun | Jul | Aug | Sep | Oct | Nov | Dec | Ann | |
|---|---|---|---|---|---|---|---|---|---|---|---|---|---|
| Years of Minima |
32 | 32 | 31 | 31 | 34 | 33 | 34 | 35 | 34 | 35 | 34 | 31 | 33.0 |
| Earliest Entry |
1952 | 1952 | 1952 | 1952 | 1952 | 1952 | 1952 | 1952 | 1952 | 1951 | 1951 | 1951 | 1951 |
| Latest Entry |
1986 | 1986 | 1986 | 1985 | 1986 | 1985 | 1985 | 1986 | 1986 | 1987 | 1985 | 1985 | 1987 |
| Years of Maxima |
32 | 31 | 28 | 30 | 35 | 34 | 33 | 34 | 34 | 35 | 31 | 30 | 33.0 |
| Earliest Entry |
1952 | 1952 | 1952 | 1952 | 1952 | 1952 | 1952 | 1952 | 1952 | 1951 | 1951 | 1951 | 1951 |
| Latest Entry |
1986 | 1986 | 1986 | 1985 | 1986 | 1985 | 1985 | 1986 | 1986 | 1987 | 1985 | 1985 | 1987 |
| Years of Rainfall |
70 | 68 | 69 | 69 | 67 | 67 | 67 | 68 | 67 | 69 | 70 | 70 | 69.0 |
| Earliest Entry |
1952 | 1952 | 1952 | 1952 | 1952 | 1952 | 1952 | 1952 | 1952 | 1951 | 1951 | 1951 | 1951 |
| Latest Entry |
2021 | 2021 | 2020 | 2021 | 2020 | 2020 | 2020 | 2020 | 2020 | 2020 | 2020 | 2020 | 2021 |
Station Details
ESPERANCE DOWNS RESEARCH STN
Southern Coastal, Western Australia
Southern Coastal, Western Australia
33.6031°S 121.7828°E
158m AMSL
Commenced 1951
Commenced 1951
Enter a postcode or town name for local weather, or text to search the site. » advanced search
Can auroras affect aeroplanes?
13:01 AEST Auroras lit up the skies on the weekend amid one of the strongest geomagnetic storms in years, but did this display impact aeroplanes and the aviation industry? The spectacular exhibit was the aurora borealis/australis, or northern and southern lights seen in both hemispheres.
- 11:00 AEST May day heat record to tumble in Perth
- 13:26 AEST More rain and storms for WA
- 13:03 AEST Welcome wet weather in parched western Tasmania this week
- 11:24 AEST Relief ahead for drenched NSW coast