- WEATHER
Australia
- National
- New South Wales
- Victoria
- Queensland
- Western Australia
- South Australia
- Tasmania
- ACT
- Northern Territory
Long Range Forecasts
- WARNINGS
- RADAR
- SATELLITE
- MAPS & CHARTS
- LONG RANGE
Long Range Forecasts
- CLIMATE
Climate Indicators
- NEWS
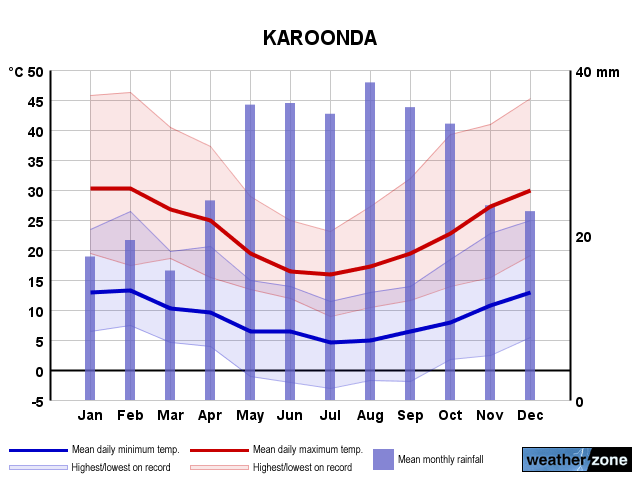
Karoonda Long-term Averages
| Jan | Feb | Mar | Apr | May | Jun | Jul | Aug | Sep | Oct | Nov | Dec | Ann | |
|---|---|---|---|---|---|---|---|---|---|---|---|---|---|
| Mean Max (°C) |
31.7 | 30.4 | 27.8 | 23.5 | 19.1 | 16.1 | 15.7 | 17.2 | 20.3 | 23.9 | 27.6 | 29.6 | 23.5 |
| Mean Min (°C) |
14.4 | 13.9 | 12.1 | 9.6 | 7.2 | 5.4 | 4.8 | 5.0 | 6.5 | 8.3 | 11.1 | 12.7 | 9.3 |
| Mean Rain (mm) |
17.9 | 19.7 | 17.0 | 24.8 | 34.8 | 34.2 | 33.4 | 36.8 | 35.3 | 31.7 | 24.6 | 24.4 | 338.9 |
| Median Rain (mm) |
9.4 | 9.6 | 6.8 | 15.1 | 26.6 | 28.4 | 24.4 | 35.4 | 27.7 | 24.2 | 20.1 | 14.4 | 287.6 |
| Mean Rain Days |
3.7 | 3.4 | 3.8 | 6.7 | 9.8 | 10.9 | 12.2 | 12.4 | 10.1 | 8.2 | 6.2 | 5.1 | 92.9 |
Karoonda Daily Records
| Jan | Feb | Mar | Apr | May | Jun | Jul | Aug | Sep | Oct | Nov | Dec | Ann | |
|---|---|---|---|---|---|---|---|---|---|---|---|---|---|
| High Max (°C) |
46.3 | 46.3 | 42.0 | 38.0 | 29.5 | 24.9 | 26.8 | 32.0 | 34.1 | 39.2 | 44.2 | 47.6 | 47.6 |
| Low Max (°C) |
17.6 | 17.0 | 18.2 | 13.9 | 9.5 | 10.5 | 8.0 | 9.8 | 11.6 | 12.6 | 15.1 | 16.5 | 8.0 |
| High Min (°C) |
28.4 | 26.9 | 25.0 | 21.0 | 15.5 | 14.0 | 12.7 | 13.4 | 17.5 | 20.6 | 26.5 | 33.0 | 33.0 |
| Low Min (°C) |
4.5 | 6.8 | 4.0 | 0.6 | -3.0 | -4.0 | -3.1 | -2.3 | -1.9 | 0.6 | 1.5 | 0.0 | -4.0 |
| High Rain (mm) |
66.0 | 104.6 | 80.3 | 56.4 | 53.3 | 47.2 | 33.3 | 33.0 | 29.2 | 57.4 | 41.9 | 73.6 | 104.6 |
Karoonda Monthly Records
| Jan | Feb | Mar | Apr | May | Jun | Jul | Aug | Sep | Oct | Nov | Dec | Ann | |
|---|---|---|---|---|---|---|---|---|---|---|---|---|---|
| High Mn. Max (°C) |
34.9 | 33.2 | 31.4 | 26.6 | 20.6 | 17.4 | 17.1 | 19.1 | 23.6 | 28.8 | 31.5 | 32.5 | 24.3 |
| Low Mn. Max (°C) |
27.3 | 27.2 | 24.5 | 20.4 | 16.9 | 14.4 | 14.8 | 15.0 | 16.4 | 20.0 | 23.8 | 26.4 | 22.5 |
| High Mn. Min (°C) |
17.2 | 15.7 | 14.4 | 11.2 | 9.3 | 7.7 | 6.5 | 6.5 | 9.0 | 10.4 | 14.8 | 14.7 | 9.9 |
| Low Mn. Min (°C) |
11.5 | 12.1 | 10.1 | 8.2 | 5.4 | 2.2 | 3.4 | 3.1 | 5.4 | 6.3 | 8.2 | 11.5 | 8.5 |
| High Rain (mm) |
98.2 | 113.1 | 114.6 | 109.2 | 98.4 | 111.1 | 79.2 | 80.6 | 119.3 | 93.6 | 80.0 | 142.4 | 601.4 |
| Low Rain (mm) |
0.0 | 0.0 | 0.0 | 0.6 | 0.8 | 1.6 | 6.2 | 2.1 | 2.6 | 0.4 | 0.0 | 0.0 | 147.7 |
Karoonda Annual Temperatures & Rainfall
Karoonda Average Number of Days With Temperatures
| Jan | Feb | Mar | Apr | May | Jun | Jul | Aug | Sep | Oct | Nov | Dec | Ann | |
|---|---|---|---|---|---|---|---|---|---|---|---|---|---|
| ≥ 40°C |
3.5 | 1.4 | 0.6 | 0.0 | 0.0 | 0.0 | 0.0 | 0.0 | 0.0 | 0.0 | 0.8 | 2.0 | 8.1 |
| ≥ 35°C |
8.4 | 6.5 | 3.6 | 0.3 | 0.0 | 0.0 | 0.0 | 0.0 | 0.0 | 1.1 | 4.3 | 6.8 | 30.4 |
| ≥ 30°C |
16.7 | 13.4 | 9.8 | 2.9 | 0.0 | 0.0 | 0.0 | 0.0 | 1.2 | 4.8 | 10.1 | 13.0 | 71.7 |
| ≤ 2°C |
0.0 | 0.0 | 0.0 | 0.1 | 1.8 | 4.3 | 5.4 | 5.0 | 2.8 | 0.8 | 0.0 | 0.1 | 20.3 |
| ≤ 0°C |
0.0 | 0.0 | 0.0 | 0.0 | 0.5 | 1.6 | 1.6 | 1.8 | 0.4 | 0.0 | 0.0 | 0.0 | 5.9 |
Karoonda 'per Week' Values (14th/86th Percentiles)
| Jan | Feb | Mar | Apr | May | Jun | Jul | Aug | Sep | Oct | Nov | Dec | Ann | |
|---|---|---|---|---|---|---|---|---|---|---|---|---|---|
| High Max |
39.3 | 37.5 | 34.5 | 28.5 | 22.5 | 18.1 | 18.1 | 20.9 | 25.0 | 29.5 | 35.5 | 37.5 | 32.2 |
| Low Max |
25.1 | 24.5 | 22.4 | 19.0 | 16.1 | 13.9 | 13.1 | 14.0 | 15.3 | 17.5 | 21.0 | 22.9 | 15.5 |
| High Min |
18.0 | 17.4 | 16.1 | 14.0 | 10.9 | 8.4 | 8.1 | 8.3 | 10.2 | 12.6 | 15.6 | 17.0 | 14.5 |
| Low Min |
10.4 | 9.7 | 8.0 | 5.8 | 3.2 | 1.8 | 1.0 | 1.4 | 2.9 | 3.6 | 6.9 | 8.5 | 3.7 |
Karoonda Data Availability
| Jan | Feb | Mar | Apr | May | Jun | Jul | Aug | Sep | Oct | Nov | Dec | Ann | |
|---|---|---|---|---|---|---|---|---|---|---|---|---|---|
| Years of Minima |
21 | 20 | 19 | 18 | 18 | 19 | 20 | 20 | 20 | 20 | 20 | 21 | 19.0 |
| Earliest Entry |
2003 | 2003 | 2003 | 2003 | 2003 | 2003 | 2002 | 2002 | 2002 | 2002 | 2002 | 2002 | 2002 |
| Latest Entry |
2024 | 2024 | 2024 | 2024 | 2023 | 2023 | 2023 | 2023 | 2023 | 2023 | 2023 | 2023 | 2024 |
| Years of Maxima |
21 | 20 | 19 | 18 | 18 | 20 | 20 | 20 | 20 | 20 | 19 | 20 | 18.0 |
| Earliest Entry |
2003 | 2003 | 2003 | 2003 | 2003 | 2003 | 2002 | 2002 | 2002 | 2002 | 2002 | 2002 | 2002 |
| Latest Entry |
2024 | 2024 | 2024 | 2024 | 2023 | 2023 | 2023 | 2023 | 2023 | 2023 | 2023 | 2022 | 2024 |
| Years of Rainfall |
109 | 109 | 109 | 107 | 107 | 104 | 101 | 102 | 108 | 108 | 109 | 110 | 108.0 |
| Earliest Entry |
1915 | 1915 | 1915 | 1915 | 1915 | 1915 | 1915 | 1914 | 1914 | 1914 | 1914 | 1914 | 1914 |
| Latest Entry |
2024 | 2024 | 2024 | 2024 | 2023 | 2023 | 2023 | 2023 | 2023 | 2023 | 2023 | 2023 | 2024 |
Station Details
KAROONDA
Murraylands, South Australia
Murraylands, South Australia
35.0900°S 139.8972°E
72m AMSL
Commenced 1914
Commenced 1914
Enter a postcode or town name for local weather, or text to search the site. » advanced search
A quick look at our water storages
12:14 AEST Given the largely clear skies across the country today, it’s a good opportunity to take a look at the water storages of Australia’s major cities. While rainfall is obviously a major contributor to the level of major dams, it is not the only factor.
- 16:15 AEST Signs indicating Australia's cool season arrival
- 07:00 AEST Bonsoy Gold Coast Pro surf forecast
- 14:48 AEST Uncontrolled WA fire causes massive smoke plume
- 11:52 AEST Storms hitting WA as Perth's wait for rain continues